What's the deal with Net Revenue Retention?
Read Time: 9 minutes
A HUGE thank you to our newsletter sponsors for moving this newsletter to free for our readers. PAID subscribers will continue to receive access to the templates from this newsletter. If you're reading this but haven't subscribed, join our community of over 1,194 crazy smart Revenue leaders. If you’d like to sponsor the newsletter reply to this email to learn more.
Today’s Paid Subscriber template is a sample NRR calculator. I’ll explore
This weeks Newsletter is brought to you by Growblocks where you can manage your full revenue engine from traffic to churn. We allow you to apply data-driven and scientific methods to grow revenue predictably and efficiently. Watch a 5 min demo of how it works here or listen in to our podcast here.
And brought to you by Coefficient which offers 18+ Google Sheets data connectors for platforms like Salesforce and Hubspot, catered to RevOps pros like us. Thanks to Coefficient, I’ve eliminated the need to copy-paste data into sheets, and blending data from multiple systems is a breeze. Click here to unlock automated reporting, snapshots, and deeper analytics in your spreadsheets.
If you’re in Japan or Taiwan between 4/1 to 4/20/2023 reach out! I’ll be in Tokyo, Osaka, and Taipei. Would love to meet with fellow GTM leaders in the area.
Stay tuned for the ROI hoodie. I’m working with the RevOps Co-Op to put together a pre-order for those that are interested.
What is Net Revenue Retention?
Net revenue retention (NRR) is a metric used to measure the percentage of revenue retained from existing customers over a certain period of time, typically a year. It takes into account the revenue gained from existing customers during that time period, as well as any revenue lost due to customer churn or downgrades.
To calculate net revenue retention, you would start with the revenue generated by all of your customers at the beginning of the period, and then subtract any revenue lost due to churn or downgrades. You would then add in any additional revenue gained from upsells, cross-sells, or other expansions of existing accounts. The result is a percentage that reflects the amount of revenue you have retained from existing customers over the course of the period.
That’s the key! With NRR, or NDR (net dollar retention), you are able to deep dive into the underlying components of the changes of the customer/revenue base:
Churn
Downgrades
Expansion
Net revenue retention is an important metric for SaaS and other subscription-based businesses, as it provides insight into the health of their customer base and the potential for growth. A high net revenue retention rate indicates that the company is retaining a significant portion of its revenue from existing customers, which is a positive sign for its long-term growth prospects.
Going below the surface of upgrades
Simply saying “expansion” or “downgrade” may not be enough to make sense of what’s happening. For example, for expansion there are a number of reasons:
Price increase
Increase in standard price. An example of this is Netflix changing their monthly price for a plan tier.
Expiration of discount. Let’s say you have a one year discount and the year is up. Well the customer expanded but not because of a change in price but rather a promotion expiration.
User increase
Usage increase
One thing to look out for is measuring the business on average unit price. Customers who have metered pricing often benefit from volumetric price drops in exchange for the increased consumption. Looking at average revenue per unit can be misleading without looking at how many customers have also increased absolute usage. Don’t be misled!
Going below the surface of a declining Net Dollar Retention (NDR)
In addition to NRR/NDR, leaders also look at retention counting logos. If net logos are flat but dollars have dropped, then customers are spending less than they were before. If Net Dollar Retention (NDR) declines, there could be several potential causes, including:
Churn: If a business is experiencing a high rate of customer churn, it can lead to a decline in NDR. Churn occurs when customers leave or cancel their subscriptions, which can result in lost revenue.
Downgrades: Downgrades occur when customers move to lower-tier plans or reduce their usage of a product or service, which can also lead to lost revenue.
Lack of Upsell/Cross-sell opportunities: If a business is not effectively upselling or cross-selling to its existing customers, it may miss out on revenue expansion opportunities that could help boost NDR.
Discounting to keep the customer: If a business threatens or decides to churn, the retention team may try to retain the customer by dropping the price.
To address a decline in NDR, businesses should first identify the underlying cause(s) and then develop strategies to address them. For example, they may need to improve their customer retention efforts, increase upsell and cross-sell opportunities, or adjust their pricing or marketing strategies to better meet the needs of their customers.
What’s considered good retention?
Casey Winters and Lenny Rachitsky ran a survey of top practitioners to understand what is considered good retention vs great retention. Here’s Casey’s original post on the topic and here’s Lenny’s if you want to read more. Lenny is also on Substack so I recommend you give his newsletter a like and a subscribe.
Here’s the summary of good vs great retention
Consumer SaaS: ~55% is GOOD, ~80% is GREAT
Bottom-Up SaaS: ~100% is GOOD, ~120% is GREAT
Land and Expand VSB SaaS: ~80% is GOOD, ~100% is GREAT
Land and Expand SMB / Mid-Market SaaS: ~90% is GOOD, ~110% is GREAT
Enterprise SaaS: ~110% is GOOD, ~130% is GREAT
So how do you calculate NRR?
Paid Subs will get access to the template calculator. But the document is structured with two tabs:
Opportunities
NRR calculation
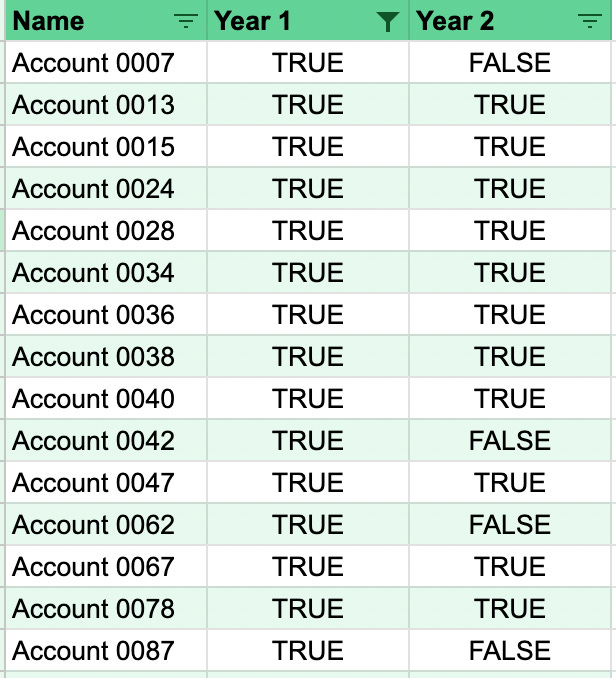
Here’s what the Opportunities tab looks like.
Once you establish your Opportunities tab, setting up a view to see if a customer’s annual renewal won. The sheet is oversimplified but still useful for a simple illustration. If you had a real Salesforce instance you would likely have expansion opportunities in the middle of the account’s term. One step further would be to report at the product line item level as opposed to just using the Amount field. The line items enables the ability to breakdown expansion and renewal line items more clearly.
With a summary table the operations team can show what’s happening overall at the logo and dollar level. The numbers in the example below don’t show a very promising business. The gross dollar churn is in the 30% area for a roughly $10,000 average contract value business selling to the VSB (very small business). The net dollar churn isn’t much different than the gross churn. This business has to continually sell to new customers just to plug the hole left behind from churned customers.
A Land & Expand sales motion to the VSB segment set good GRR at 80% and great at 100%. This business is well below those thresholds. Not certainly one that deserves a high valuation multiple.
A simple example with Expansion included
The example above takes a summarized view at the account. But let’s break out two different companies to see how the revenue flows for the two.
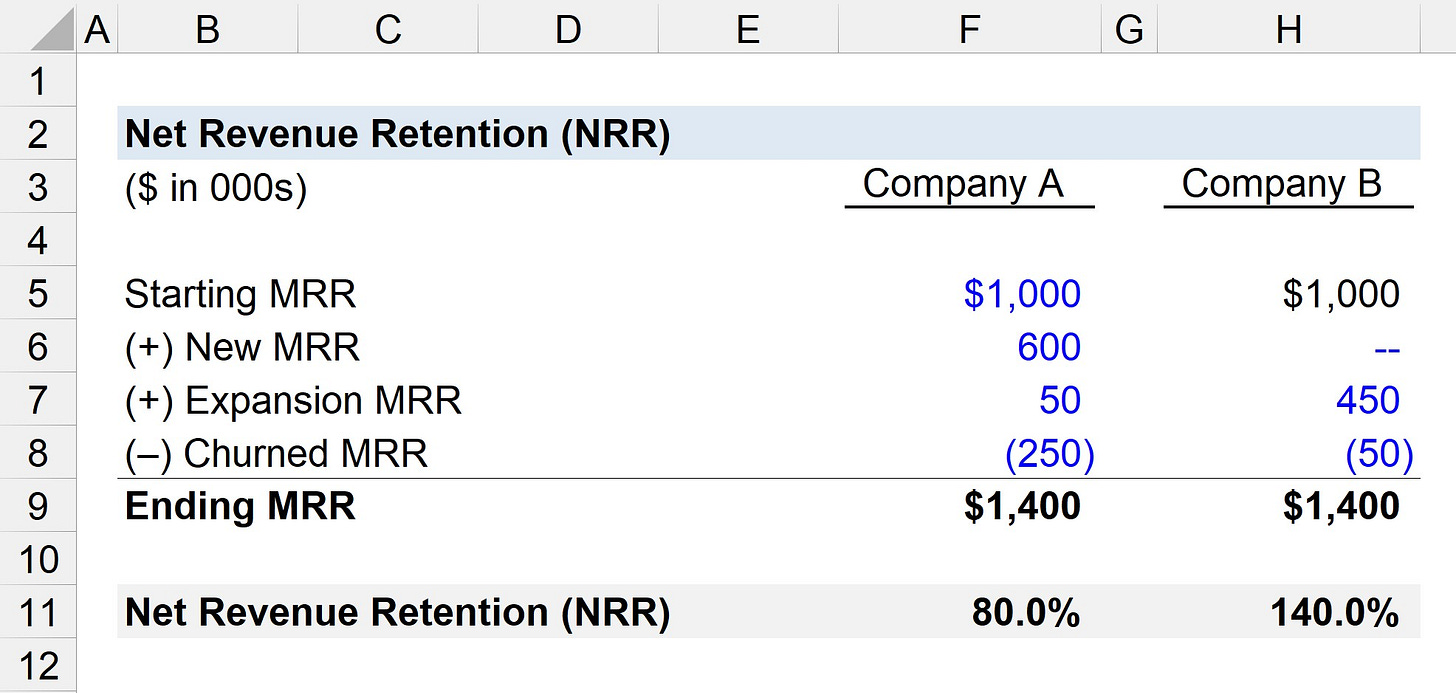
Both Company A and B have an MRR of $1,000,000 (ARR of $12,000,000). Both companies also ended the year at $1,400,000 MRR ($16.8M ARR). BUT! There’s a BIG difference between both companies.
Company A sold $600,000 MRR ($7.2M ARR) of new business this year. Company B did not sell any new business. Company A suffered 5x as much as churn than its counterpart. Company A has to continually sell their way out of the hole in their leaky bucket called churn. Company B on the other hand doesn’t need to build out an acquisition engine. Instead, their customers expand to reach the same revenue as their peer. I’ll take NRR of 140% any day of the week!
Thanks for reading this far!
Next week I’ll dive into how to potentially set up your Salesforce instance to automate renewal creation.
Whenever you're ready, there are 2 ways I can help you:1/ If you’re looking to further develop your Revenue Operations knowledge sign up for my courses in partnership with the RevOps Co-Op. → Unleashing ROI course. A ten-week virtual, live instruction RevOps course designed to level up your RevOps Impact (R.O.I.). Lessons from my career scaling from $10M to $100M+. Join 50+ alumni. https://www.revopscoop.com/learn/unleashing-roi-course→ Sales Ops Masterclass. A six-week virtual, live instruction SalesOps course designed to take your sales operations skills to the next level. https://www.revopscoop.com/learn/salesops-masterclass2/ Promote your Revenue focused startup to a newsletter with over 900 tenacious revenue leaders. My eventual goal is to shift this to a completely free newsletter for my readers through sponsored ads. Reply to this email if you’re interested in receiving a media kit to learn more.Paid Subscriber Template
NRR simple calculator (paid template below the fold)
Keep reading with a 7-day free trial
Subscribe to RevOps Impact Newsletter to keep reading this post and get 7 days of free access to the full post archives.


