


Sales Operations Toolbelt
PCR, Win Rate, Hygiene Standards, Stalled Deals

This week I’d like to cover a few metrics and tools Sales Operations can use to QA the Sales Pipeline and Performance. These are a mix of leading and lagging indicators to assess the relative health of the organization. Use them wisely.
So let’s introduce each of the topics we’ll go over briefly today:
Pipeline coverage ratio
Win rate
Pipeline hygiene
Stalled deals
Let’s get right into it.
Pipeline Coverage Ratio
Pipeline Coverage Ratio (PCR) is the measurement of how much pipeline you have relative to your quota for a given period. Having sufficient pipeline should provide a safety of margin. Having too little pipeline should serve as an early warning sign to attaining plan. Pipeline coverage ratio can be defined as:
Total Pipeline (Period) / Gap to Plan (Period)
Let’s take a look at an example:

If the quota in this period is $180,000 then the pipeline coverage ratio in this example is 5x.
A variation of the pipeline coverage ratio is to take a look at a Weighted Pipeline Coverage ratio. If you know your win probabilities by stage you can derive a more nuanced view of pipeline ratio.
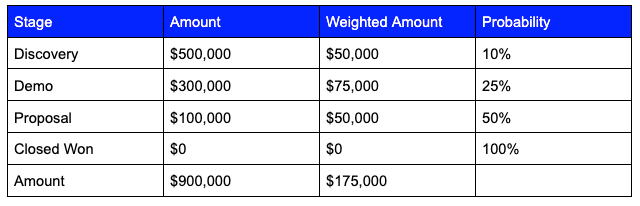
In the weighted example the pipeline coverage ratio is rounded up to 2x.
Win Rate
Win rates can be defined in a multitude of ways. Depending on how you define it, it can mean different things. The most common definition of win rate is simply:
Won Opportunities / Closed Opportunities
This definition helps to understand what percentage of concluded opportunities resulted in a win. If the past is prologue, then Sales Operations can assess the current pipeline with an estimated view of how many deals in the pipeline will result in a win. Be sure to denote how you’re calculating the win rate. The two most common sub-definitions of win rate is the opportunity win rate and the dollar win rate.
Opportunity Win Rate is simply the number of won opportunities over the number of closed opportunities. This
Keep reading with a 7-day free trial
Subscribe to RevOps Impact Newsletter to keep reading this post and get 7 days of free access to the full post archives.