Read Time: 9 minutes
A HUGE thank you to our newsletter sponsors for moving this newsletter to free for our readers. PAID subscribers will continue to receive access to the templates from this newsletter. If you're reading this but haven't subscribed, join our community of over 1,175 crazy smart Revenue leaders. If you’d like to sponsor the newsletter reply to this email to learn more.
Today’s Paid Subscriber template is a sample sales rep scorecard using our Sponsor’s tool.
Also… what I’m jamming to. Please reply with a song you love and I’d love to feature it 😎This week’s newsletter is a deep dive into Coefficient, which offers 18+ Google Sheets data connectors for platforms like Salesforce and Hubspot, catered to RevOps pros like us. Thanks to Coefficient, I’ve eliminated the need to copy-paste data into sheets, and blending data from multiple systems is a breeze. Click here to unlock automated reporting, snapshots, and deeper analytics in your spreadsheets. Build your Sales Team Leaderboard today.
Ever hear of the leader that “manages by results”? I’d argue that’s not a leader. Instead, a leader manages for results as Peter F. Drucker once titled a book. Imagine you hear a sales leader telling a rep…
“you need to win at a higher rate”
“you need to increase your average contract size”
“you need to develop more pipeline”
Got it chief. I’ll just snap my finger and *POOF* more of the above will magically happen.
What really drives improvement is adjusting behavior. Doing the right things, plus combining that will a bit of good timing and luck, should lead to promising results given a long enough horizon.
So how do you go about this?
Much like a cohorted pipeline review works wonders as a leading indicator for the business, a rep scorecard should do the same for team performance.
So today I’m going to walk you through how to set one up for you and your business. You can use whatever tool you want but I use Coefficient since I’ve been modeling a spreadsheet based scorecard.
What is a scorecard?
Before I go into the nitty gritty. Let’s give some context. The balanced scorecard was invented by Dr. Robert S. Kaplan, a Professor of Accounting at Harvard Business School, and Dr. David P. Norton, a management consultant and author, in the early 1990s. They first introduced the concept in a series of articles published in the Harvard Business Review in 1992 and 1993, and later expanded upon it in their book "The Balanced Scorecard: Translating Strategy into Action" which was published in 1996.
Here's what I believe are the strengths of a scorecard for sales reps:
Aligning business goals: The balanced scorecard helps to align the organization's goals and strategies with its mission and vision. By identifying key performance indicators (KPIs) in each of the four perspectives, organizations can ensure that all departments and employees are working toward common goals.
Measuring performance: The balanced scorecard provides a framework for measuring performance in a comprehensive and balanced way. By tracking KPIs in all four perspectives, organizations can get a more accurate picture of their overall performance, rather than just focusing on financial results.
Improving communication: The balanced scorecard facilitates communication between different departments and levels of the organization. By sharing the scorecard with employees and stakeholders, everyone can see how their individual goals and actions contribute to the organization's success.
Encouraging continuous improvement: The balanced scorecard encourages organizations to focus on continuous improvement in all areas of the business. By regularly reviewing and updating the KPIs and targets, organizations can identify areas for improvement and take action to address them.
What should go into a sales rep scorecard?
A sales rep scorecard is going to look different than a traditional balanced scorecard. What metrics do you want to see? Here’s a few ideas:
Account engagement % - what percentage of your territory have you had activity on in the last 60 days
Contacts targeted per account - how many contacts are you going after per target account?
Target persona compliance - of the contacts you’re going after do they fit your persona?
Activity - this can be a vanity metric for some, but for certain sales motions (targeting VSB - very small business, SMB - small medium business) it can be a North Star
Calls to Power - of the calls made, how many of them are calling a position of authority?
Pipeline sourced - what percentage of their pipeline was self sourced?
Pipeline progression rates - relative to other reps, how is each rep performing at each stage of the funnel?
These metrics should come from your CRM. Cohort your reps based on their tenure. When doing this I highly suggest using a trailing 90 or 120-day data set. This will baseline the data to compare apples-to-apples.
Here’s a sample scorecard:
Set up your benchmarks
One method would be to take the average or the median for each metric. For example, let’s say these are your benchmarks.
The median is useful because it will show you who is in the upper half and who is not. Some organizations force a Reduction In Force (RIF) with a certain percentage of performers. The scorecard is meant to identify issues AHEAD of time. By using this scorecard with senior leaders you’ll be able to identify where certain reps have strengths and where others have weaknesses. If used on a regular basis, you can create a tailored coaching plan for the team and/or for an individual.
Setting up your data connector
I mentioned I was using Coefficient as a Google Sheet extension. Here’s how I set up the rest of the tabs by using the extension to pull in required data for the analysis.
Tab #1: Accounts tab
Tab #2: Contacts tab (even better you could set up an out-of-the-box rollup summary application since Salesforce does not have a rollup summary field for lookup relationships… consider using this Salesforce Ben article to figure out how.)
Tab #3: Opportunity tab. You should have a setup that tracks if a stage has been reached. See the Developing Sales Stages article to learn how to set this up.
If you know SOQL, you can write your own queries…
ACCOUNT Tab #1
SELECT Id, Name, OwnerId, Owner.Name, LastActivityDate FROM Account
ACCOUNT Tab #2
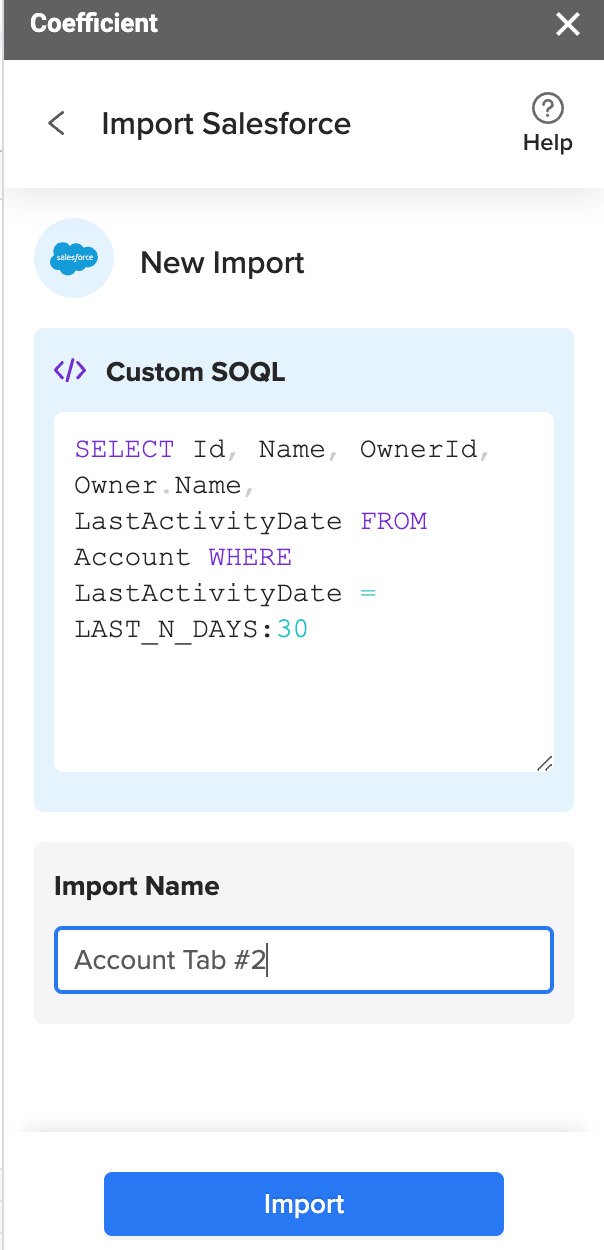
SELECT Id, Name, OwnerId, Owner.Name, LastActivityDate FROM Account WHERE LastActivityDate = LAST_N_DAYS:30
CONTACT Tab
SELECT Id, Name, Title, Persona__c, AccountId, OwnerId, Owner.Name FROM CONTACT WHERE LastActivityDate = LAST_60_DAYS
For simplicity’s sake let’s assume you have a custom boolean field called Persona (Persona__c) which is set to TRUE based on a formula field. The formula would be a CONTAINS function which checks if certain keywords are in the job title.
OPPORTUNITY Tab
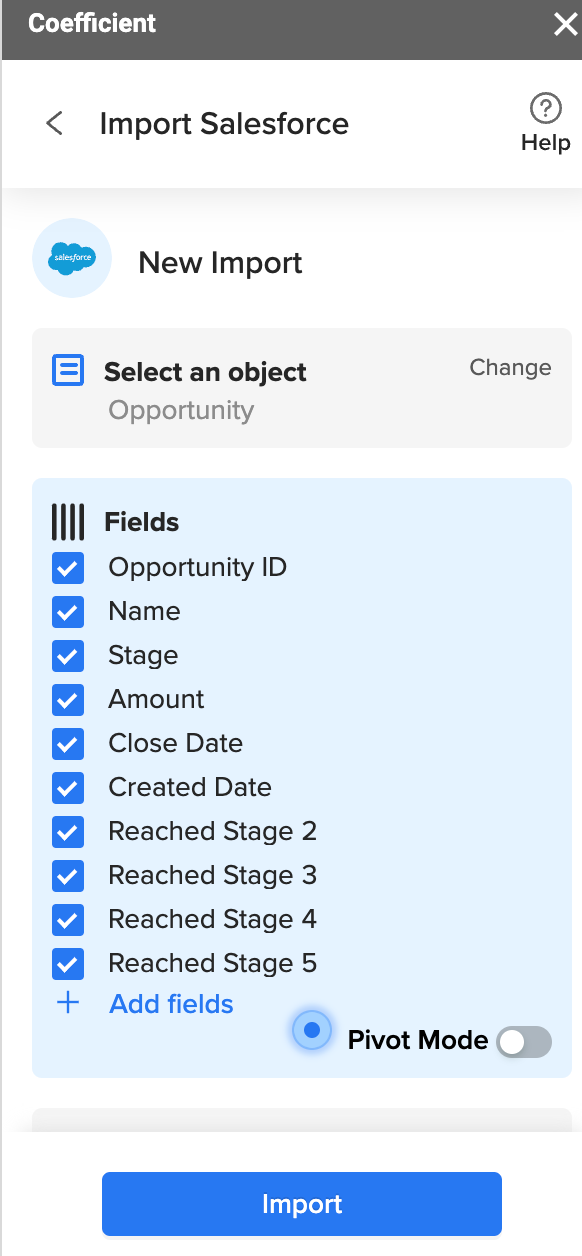
SELECT Id, Name, StageName, Amount, CloseDate, CreatedDate, Owner.Name, Reached_Stage_2__c … Reached_Stage_5__c FROM OPPORTUNITY
Or you can keep it simple and just add fields and a filter
I still like to write my own queries and be familiar with the backend, but that’s just my preference. If you’re not handy with SOQL you can just use the field selector in Coefficient. Voilà!
Now we need a bunch of spreadsheet formulas
Putting the math together is the straightforward part. Use a few countifs formulas and you'll be able to collect all the information you need. If you have a paid account with Coefficient set your refresh interval to daily. When you revisit the scorecard you'll be able to see fresh data each time.
If you have a paid account with Coefficient, you can set your automated refresh interval to daily. When you revisit the scorecard you'll be able to see fresh data each time. On their Free plan, you’ll have the ability to refresh your data with the click of a button on your data import(s) tab(s) right within your spreadsheet.
At the bottom of the scorecard set up a new set of rows to capture the ranking of each rep per category. Google Sheets has a handy RANK function. This will do the work for you per column.
UNIQUE function
I use this function to grab the names of the account owners. Right away I notice there are some issues in the data quality. The sales reps are Ty Cobb, Joe DiMaggio, Jesse Owens, and Sugar Ray Robinson. I’m going to group or hide the rest.
COUNTIFS function
This function is used to fill out the rest of the scorecard leveraging the raw data imported into the data tabs mentioned above.
Progression Rates
The key to determining how reps perform up and down the funnel is to examine stage progression rates. Reps may do well at the top of the funnel, for example, but struggle middle or late in the funnel. This is an opportunity for enablement to build a custom program to improve the lot of that rep.
Key to this is to build out either custom Opportunity fields OR to leverage an Opportunity Field History report. I normally push for the Field History report but a custom field setup works just as well.
Here’s how the data looks in the data tabs.
Performance Monitoring
Now that you have your scorecard set up, what’s the next step?
Sales leadership and operations uses the dashboard to monitor for any trends. Similar to a cohort view of a pipeline the scorecard is used to identify troubling areas. One method of identifying trends is to snapshot the data into a week-over-week view. Concerning to some observers is the high frequency of observing the data. It leads to a sense of micromanagement. Depending on your sales motion, the frequency for certain metrics can be viewed daily. Think of an SDR team that’s highly dependent on call activity and persona compliance. For an Enterprise organization looking at activity metrics doesn’t move the needle all that much. Instead, you might want to look at engagement at the account level and check to see if meetings are being scheduled or held with those in power.
Either way, find an operating cadence that works for your team. Then starting putting it into practice. Here’s a possible workflow to consider.
Whenever you're ready, there are 2 ways I can help you:1/ If you’re looking to further develop your Revenue Operations knowledge sign up for my courses in partnership with the RevOps Co-Op. → Unleashing ROI course. A ten-week virtual, live instruction RevOps course designed to level up your RevOps Impact (R.O.I.). Lessons from my career scaling from $10M to $100M+. Join 50+ alumni. https://www.revopscoop.com/learn/unleashing-roi-course→ Sales Ops Masterclass. A six-week virtual, live instruction SalesOps course designed to take your sales operations skills to the next level. https://www.revopscoop.com/learn/salesops-masterclass2/ Promote your Revenue focused startup to a newsletter with over 900 tenacious revenue leaders. My eventual goal is to shift this to a completely free newsletter for my readers through sponsored ads. Reply to this email if you’re interested in receiving a media kit to learn more.Paid Subscriber Template
Sample AE scorecard (paid template below the fold)
Keep reading with a 7-day free trial
Subscribe to RevOps Impact Newsletter to keep reading this post and get 7 days of free access to the full post archives.


