A HUGE thank you to our newsletter sponsors for moving this newsletter to free for our readers. PAID subscribers will continue to receive access to the templates from this newsletter. If you're reading this but haven't subscribed, join our community of over 1,127 crazy smart Revenue leaders. If you’d like to sponsor the newsletter reply to this email to learn more.
Today’s Paid Subscriber template is an extension of the unit economics worksheet to incorporate NPV, ROI, and IRR.
Also… what I’m jamming to. Please reply with a song you love and I’d love to feature it 😎
This weeks Newsletter is brought to you by Growblocks where you can manage your full revenue engine from traffic to churn. We allow you to apply data-driven and scientific methods to grow revenue predictably and efficiently. Watch a 5 min demo of how it works here or listen in to our podcast here.
And brought to you by Coefficient which offers 18+ Google Sheets data connectors for platforms like Salesforce and Hubspot, catered to RevOps pros like us. Thanks to Coefficient, I’ve eliminated the need to copy-paste data into sheets, and blending data from multiple systems is a breeze. Click hereto unlock automated reporting, snapshots, and deeper analytics in your spreadsheets.
Before I moved into the world of RevOps I was part of the FP&A (finance, planning and analysis) team at Google and Intel. One thing that's always fascinated me is the intersection of economics and finance. To this day I still view much of what I do in RevOps from a finance lens. Doing so helps me think of what else I could use in my tool belt to help the business.
I’ve hired and led some amazing Ops talent from all different walks of life. Some were previously business analysts. Some were SDRs. Some were systems administrators. In every single case there was always a dimension of RevOps to learn. No one has the “perfect” background for it. I didn't have the systems background so I spent countless nights learning Salesforce, Marketo, Python, SQL, and Looker. I had to in order to empathize with my team or to roll up own sleeves when we faced capacity shortfalls.
So today I'd like to walk through some financial concepts that you might apply in revenue operations. The three concepts are:
Return on Investment
Net Present Value
Internal Rate of Return
This sounds like finance mumbo jumbo but I promise you I will put this into a RevOps context. After all, this is a RevOps newsletter!
Return on Investment
As always, let’s start with a definition. Return on Investment (ROI) is a financial metric used to evaluate the profitability of an investment. It is calculated by dividing the net profit generated by an investment by the total cost of the investment, and expressing the result as a percentage or ratio.
The formula for calculating ROI is:
ROI = (Net Profit / Total Cost) x 100%
Net Profit is the amount of money earned from an investment, minus any expenses related to that investment. Total Cost is the total amount of money invested in the project, including all direct and indirect costs.
ROI is commonly used to assess the profitability of investments in stocks, real estate, and other financial assets. It is also used by businesses to evaluate the return on investment for marketing campaigns, product development, and other initiatives.
A high ROI indicates that an investment is generating a significant profit relative to its cost, while a low ROI may suggest that the investment is not generating sufficient returns. However, it's important to note that ROI should be considered in the context of the specific investment, and should be compared to industry benchmarks and other similar investments.
So for example let's go back a few weeks to the article where we talked about unit economics. In the paid template we had a Gross Margin of 75% (what’s considered a good gross margin for SaaS) and a CAC of $133,951. RevOps may not have all of the below the line expenses but it can put together a quick back-of-the-envelope math with the data we do have. In some ways we could put together an ROI on the GTM motion.
With the ROI formula we would simply modify Net Profit to be Gross Margin - CAC. This is overly simplified but let's roll with it. Instead of Total Cost we would adjust it to COGS (or Sales x Gross Margin) + CAC.
Running the math, it would play out as:
ROI = (Net Profit / Total Cost) x 100%
GTM ROI = ((Gross Margin - CAC) / ((Sales - (Sales x Gross Margin)) + CAC)
GTM ROI = (($88,000 - $133,951) / ($110,000 - ($110,000 x 85%)) + $133,951)
With this number you'll be able to compare your ROI to other benchmarks. You'll also be able to break down the components to understand which drivers are improvable over time.
Now there are a few flaws to looking at ROI. It doesn't take into account timing of cash flows. In fact, the example above looks just at year 1 cash flows. A true ROI should take into account the lifetime of cashflows. Let's say that your expenditures last several years because you're selling into a space where deals last longer than one year. One firm could front load their expenses while another would have theirs back loaded. Because you could take that money and invest it into a safe, interest bearing vehicle the principle would have grown during the course of that time. For example, if your risk free vehicle was 5% then $100,000 invested last year would be $105,000 today. In this case you could say that $100,000 is the same as $105,000 next year. This is a concept called Time Value of Money (TVoM) The key concept to know is what rate you should use when you're examining this TVoM concept.
source: rehabfinancial.com
So here comes Net Present Value (NPV)
A favorite finance concept of mine is NPV. This solves for the timing issue of cash flows. TL;DR… it a project has an NPV greater than 0. Go for it Otherwise, it’s a no go. But if you're unfamiliar with the concept let's go over it real quick then I'll dive into our RevOps example.
It is a financial metric used to evaluate the profitability of an investment by comparing the present value of expected cash inflows from the investment to the present value of the cash outflows required to make the investment.
Cash inflows represent the expected cash generated by the investment over a certain period of time.
r is the discount rate, which represents the opportunity cost of investing in this project versus investing in an alternative with a similar level of risk. The discount rate is usually based on the cost of capital or the required rate of return.
n is the number of periods over which cash flows are expected to be generated (usually years).
Initial investment is the total amount of cash that is required to make the investment.
A positive NPV indicates that the investment is expected to generate profits, while a negative NPV indicates that the investment is expected to result in losses. When comparing multiple investment options, the investment with the highest NPV is generally considered to be the most attractive option.
So how do you perform an NPS analysis with the paid template?
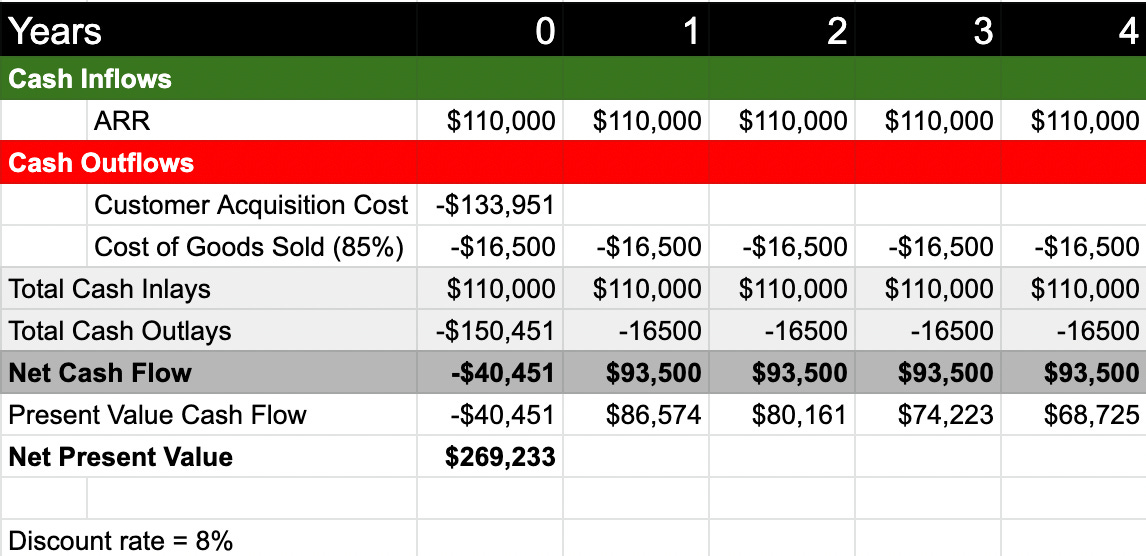
Example #1: customer stays with you for 5 years (assume 20% churn per cohort
The NPV is fantastically positive! There’s a recurring cost to keep the product running which we’ve lumped into the Cost of Goods Sold line item. Remember, SaaS companies lump in CSMs and support in COGS (see Gainsight article here).
Example #2: what ARR do we breakeven for NPV?
Now let's say you have request for a deal for less than $36,545.50. Should you do it? Assume you don’t change the level of support you provide. You treat this customer the same as every other customer. You still expect this customer to stick around for 5 years.
The math says no. Why? Because NPV is below zero! This is an absolute no go.
A deal at exactly $36,545.50 would mean that it neither creates wealth nor destroys it for the business.
How else can you tweak the model?
For starters, let’s not renew deals at a flat rate. Bake in those price increases. Why? Because presumably, you are increasing the costs to support and service customers. Also, I imagine your product costs will go up over time. Businesses need to keep pace. If you don’t add those price increases on the top line and you see your costs increase over time then you are going to witness a declining NPV.
Some tweaks you could make:
Price increases (mentioned above)
Account for salary increases year over year
Include other OpEx (operational expenditure) costs (our example only looks at things from a GTM point of view, but there are plenty other expenditures to consider)
This model above is a per customer view so it assumes a five year duration
There’s no segmentation in the model. Instead you’re looking at a blended view and as I’ve said before… blended averages are dangerous!!!
One other tool you could use is to determine if that project creates wealth (accretive) or decreases wealth (dilutive) to the firm. One method of doing this is to calculate the Internal Rate of Return (IRR) If the project return rate exceeds this IRR then go for it.
All systems go!
What is Internal Rate of Return?
IRR stands for Internal Rate of Return. It is a financial metric used to evaluate the potential profitability of an investment or project. The IRR is the discount rate that makes the net present value (NPV) of all cash flows from the investment or project equal to zero.
In simpler terms, IRR represents the rate of return that an investment is expected to generate over its useful life. It takes into account the time value of money and considers all cash inflows and outflows associated with an investment or project, including the initial investment, ongoing expenses, and expected future returns.
IRR is a commonly used metric in financial analysis and is often used to compare different investment opportunities. A higher IRR indicates a more profitable investment, while a lower IRR indicates a less profitable one. However, IRR should not be used in isolation and should be considered alongside other financial metrics to make informed investment decisions.
In our previous example, what we would do is to replace the little r in our NPV calculation with a big R. This new variable, R, will be the rate we need to overcome in order for this project to be financially positive for the firm. Call this your hurdle rate.
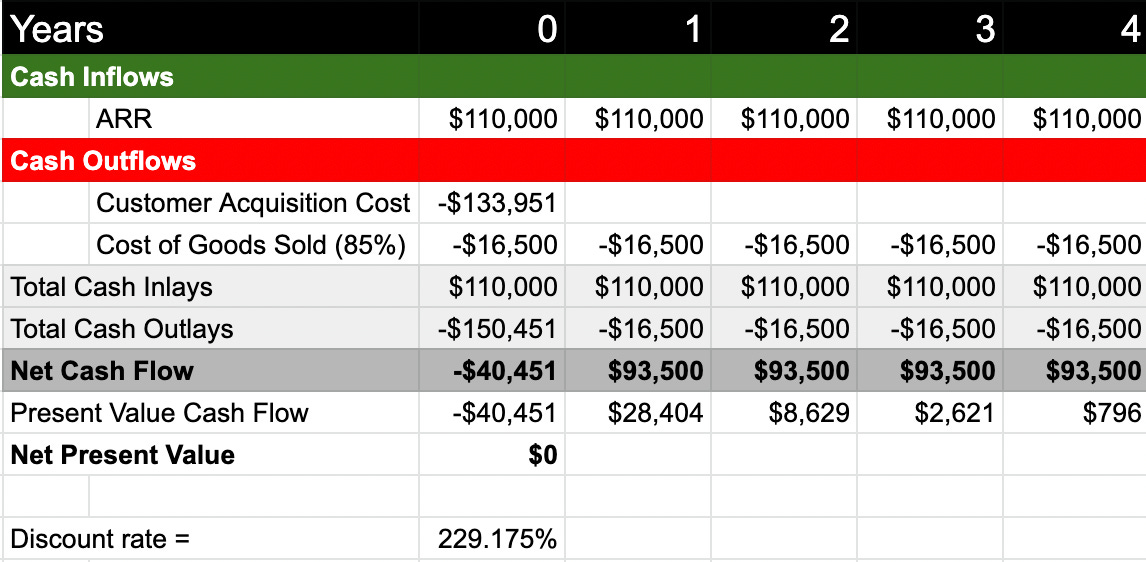
Let's plug in the numbers from the previous example.
Because the customer is around for 5 years and costs are flat the IRR rate is 229.18%. You can see that NPV is basically zero. This customer is EXTREMELY profitable.
MACRO also affects how this model works
Remember, I used a stupidly simple 8% as the discount rate above. But with the Federal Reserve now increasing the risk-free rate, investors have a choice to earn 5% on a two-year treasury bill or to invest in your risky business. Now, more than the last few years investors and business owners may just choose to shift investable dollars to fixed income assets instead of corporate projects that may or may not yield the same result. You have to clear your new hurdle rate!
If you really want to be a finance wonk you can look up how to use the Weighted Average Cost of Capital to calculate which rate to use. Here is a great guide on how to do it.
As you can see, many of these variables have changed for the worse over the last four quarters. This means that your discount rate has SHOT UP! And therefore your outlying cashflows are worth less (or worthless? 😅) in today’s dollars. Most startups don’t have a whole lot of debt so the second half of the equation is zeroed out. Instead, you’ll want to focus on the left hand side of the equation. The key variable to calculate is the cost of equity. Wallstreetmojo shows how to calculate Cost of Equity.
Or you can just look it up. Here’s NYU Stern’s updated Cost of Equity figures by industry. The Software Industry (Internet) figure is 13.09! That is quite the discount rate to overcome.
Also, according to Crunchbase a startup should spend roughly 40% of its expenses on Sales and Marketing. Let’s run the example one more time by adding in the new discount rate as well as a general non-Sales/Marketing OpEx line item. The discount rate comes down quite a bit. I’m also lumping in the other OpEx items under year one only.
Thanks for reading a bunch of finance babble for RevOps
I hope this was fun for you. A little finance can go a long way in helping you think through whether or not you should do a project. Or if the project needs to de-risk certain variables in order to make it a viable positive endeavor for the company.
Paid subscribers will get access to the financial template covering the example. Appreciate all of you who have made it this far. 🙏
Whenever you're ready, there are 2 ways I can help you:
1/ If you’re looking to further develop your Revenue Operations knowledge sign up for my courses in partnership with the RevOps Co-Op.
→ Unleashing ROI course. A ten-week virtual, live instruction RevOps course designed to level up your RevOps Impact (R.O.I.). Lessons from my career scaling from $10M to $100M+. Join 50+ alumni. https://www.revopscoop.com/learn/unleashing-roi-course
→ Sales Ops Masterclass. A six-week virtual, live instruction SalesOps course designed to take your sales operations skills to the next level. https://www.revopscoop.com/learn/salesops-masterclass
2/ Promote your Revenue focused startup to a newsletter with over 900 tenacious revenue leaders. My eventual goal is to shift this to a completely free newsletter for my readers through sponsored ads. Reply to this email if you’re interested in receiving a media kit to learn more.
Paid Subscriber Template
RevOps Finance Template (link below for paid members)
Keep reading with a 7-day free trial
Subscribe to RevOps Impact Newsletter to keep reading this post and get 7 days of free access to the full post archives.