
Measuring wallet share

Most RevOps teams know their ARR number to the dollar. They know NRR. They know logo churn. What they usually cannot tell you is what percentage of each customer’s total available spend they are actually capturing. That gap matters more than most people realize, because it means expansion opportunities are being sized incorrectly, account prioritization is based on incomplete data, and QBR conversations are happening without the context that would make them useful.
Wallet share is a simple concept in theory. You take a customer’s current ARR, divide it by what they could theoretically pay you, and you get a percentage. Low percentage means room to grow. High percentage means you have either succeeded or saturated. The hard part is the denominator. “What they could theoretically pay you” is not a single number with a single formula. It is a calculation that depends entirely on how you charge, and most B2B companies have not made that calculation explicit.
This article is about building a rigorous, practical approach to wallet share measurement across the pricing models you are most likely to encounter. The framework works whether you are a RevOps practitioner trying to build it for your own company or a revenue leader trying to understand where to focus a team of AEs.
Why ARR alone does not tell you where you stand
Revenue operations evolved from the recognition that a company’s commercial data deserves the same rigor applied to its operational data. We track pipeline coverage ratios, forecast accuracy, sales cycle length, and quota attainment. But most RevOps teams track ARR in a way that is fundamentally backward-looking. ARR tells you what a customer decided to pay in the past. It does not tell you what they could pay next.
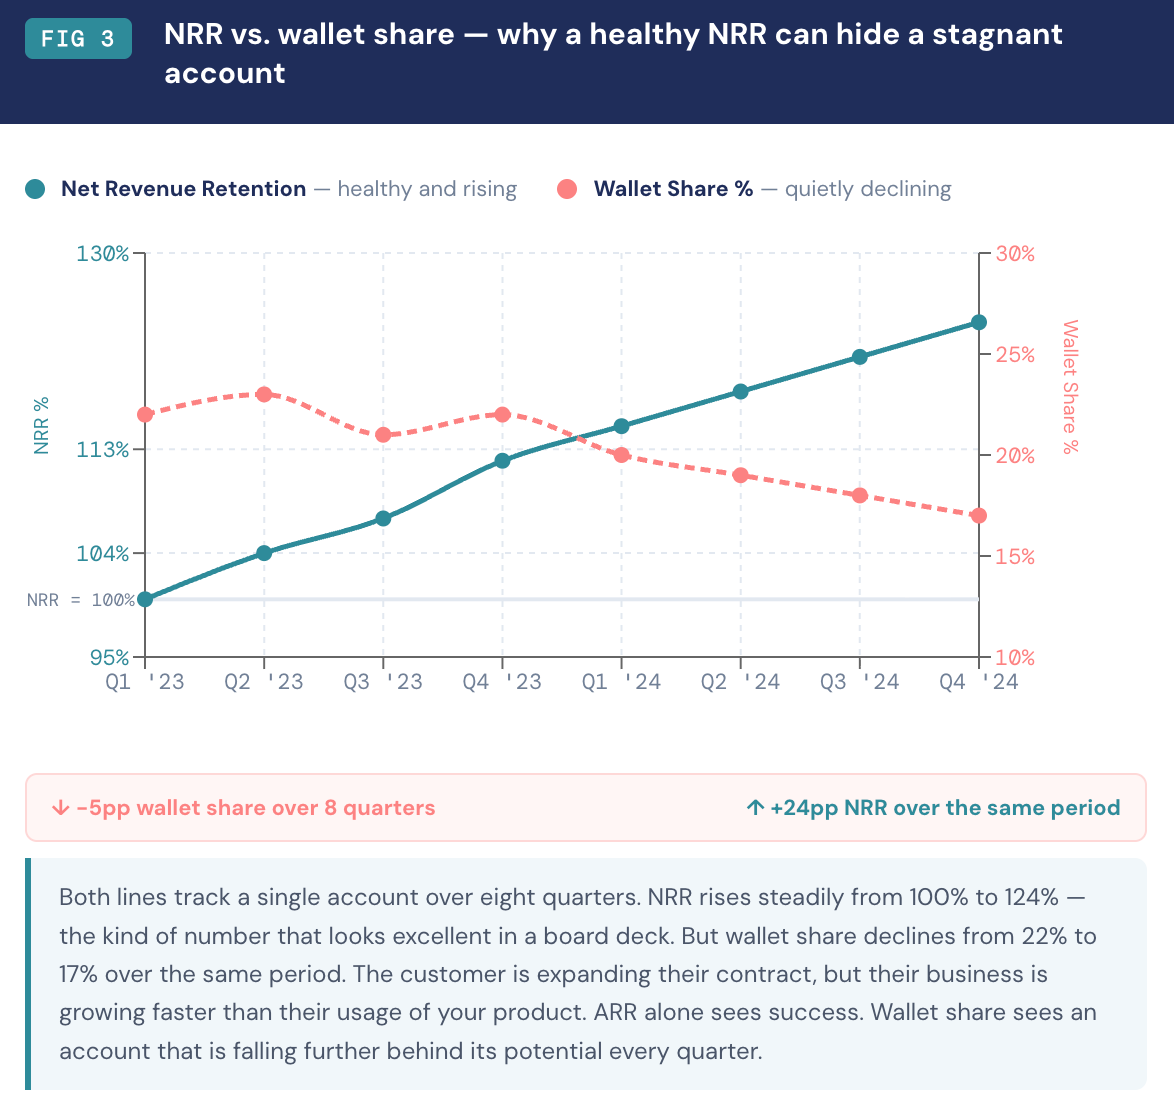
Net revenue retention is the closest most companies get to a forward-looking signal. NRR above 100% means expansion is outpacing churn within the existing base. NRR below 100% means it is not. But even strong NRR numbers mask a critical question: expansion relative to what? If a customer is growing their contract by 15% per year but represents only 20% of their potential spend with you, that account is underperforming your opportunity regardless of how good the NRR looks.
Total Addressable Wallet, or TAW, is the theoretical maximum a given customer could pay you given their current business size, structure, and needs. Wallet share is the ratio of their current ARR to their TAW. A customer at 30% wallet share is an expansion candidate. A customer at 85% wallet share needs a different conversation, one about strategic alignment, referrals, upsell into adjacent products, or the terms of a long-term renewal.
The reason most RevOps teams do not calculate TAW is that it feels like guesswork. And without a clear methodology, it is. With one, it becomes a defensible estimate you can put in a CRM field, connect to a quota model, and use to run territory planning. The methodology starts with the pricing model.
The pricing model determines everything
B2B companies do not have one pricing model. They have several, often running in parallel across different product lines or customer segments. Each model implies a different TAW calculation, a different set of observable signals, and a different expansion motion. Getting wallet share right means knowing which model governs each part of each customer relationship.
Unit throughput models price on discrete events or outputs. Blend Labs, a mortgage origination platform, charges banks and credit unions a per-application or per-funded-loan fee. A regional bank processing 2,000 mortgage applications per month has a TAW ceiling defined by its origination volume multiplied by the per-unit rate. The RevOps question is: what is the bank’s total origination volume, and what share of those transactions flows through Blend? A customer with 5,000 monthly applications running 1,000 through your platform is at 20% wallet share. The TAW calculation here is straightforward because the unit of value is the same unit the customer already tracks for their own business purposes. Volume data is observable, at least directionally, from deal structure, renewal conversations, and public data sources.
Veeva’s OpenData product represents a more complex variant. Veeva sells pharmaceutical companies access to healthcare professional contact data, pricing by country based on the number of HCP records in that country. A pharma company expanding into five European markets pays a summed fee based on record counts per country. Their TAW ceiling is the total number of HCP records globally in markets where they sell. As that company enters new geographies, the TAW expands with them. This dynamic means RevOps teams at companies like Veeva need to track not just current ARR but also the customer’s geographic expansion plans, because that is the leading indicator of TAW growth.
Application and module count models are common in enterprise software where the platform covers a defined set of functional areas and each area is licensed separately. Imubit, an industrial AI company focused on oil refinery optimization, illustrates this clearly. Imubit deploys closed-loop AI optimization applications against discrete process units inside refineries: a fluid catalytic cracker, a reformer, a crude distillation unit, a blending header. Each is a separate application, and each delivers measurable margin improvement of roughly $0.30 to $0.50 per barrel processed through that unit. A refinery with 12 optimizable process units that has deployed three Imubit applications sits at 25% wallet share. The TAW is the total number of optimizable units multiplied by the contract value per application.
What makes this archetype particularly tractable for RevOps is that the ceiling is physically bounded. You can count the process units at a refinery. You can cross-reference Imubit’s own customer documentation, which cites Big West Oil and Monroe Energy as customers with multiple deployed applications. The expansion path is visible from outside the account.
Veeva Vault operates on the same logic in life sciences. Each Vault application covers a distinct regulatory or content management function: QualityDocs, Vault RIM for regulatory submissions, Vault Clinical for trial management, Vault PromoMats for marketing materials, Vault Safety for pharmacovigilance. A mid-size pharma company running two Vault modules with a regulatory and quality infrastructure that justifies four more has low wallet share by application count, regardless of what their ARR looks like in absolute terms. The expansion opportunity is hiding in plain sight.
Seat-based models are the most familiar to RevOps practitioners. The TAW formula looks simple: relevant headcount multiplied by price per seat. The complexity is in the word “relevant.” HubSpot’s Sales Hub, priced at $90 per seat per month at the Professional tier, is not relevant to every employee at a customer company. It is relevant to quota-carrying sales representatives, sales managers, and potentially sales operations professionals. At a 500-person company with 80 salespeople, TAW on Sales Hub is 80 times $90 times 12, not 500 times anything.
This matters because RevOps teams often define TAW loosely as total headcount. That overstates the ceiling, making wallet share look artificially low and driving misallocated expansion effort. The right denominator for seat-based TAW is role-specific headcount, which changes as the customer’s hiring plans evolve. A customer that has told you they are building out a 30-person enterprise sales team is signaling TAW expansion before it shows up as revenue. That conversation belongs in CRM as structured data, not in an email thread.
Salesforce represents the extreme of this archetype. Enterprise tier pricing has reached $500 per seat per month at the top of the stack, and Salesforce’s growth over recent years has been meaningfully driven by per-seat price increases rather than net new customers alone. Their shareholders see this plainly in the annual reports. For RevOps teams selling into organizations that run Salesforce, the competitive analysis has to account for how much budget is already committed to that line item.
Outcome and performance-based models create the most dynamic TAW calculations because the ceiling moves with the customer’s own results. PROS Holdings, which sells revenue management and CPQ software to airlines and B2B distributors, structures enterprise contracts to share in the margin improvement their platform generates. As a customer’s yield improves or their quote-to-win rate increases, the value of the platform grows, and in well-designed outcome contracts, the vendor’s revenue grows with it.
The RevOps challenge here is that TAW is not calculable from a fixed formula. A prospect’s current revenue base, their pricing maturity, and their willingness to link payment to performance all affect the number. What you can model is a scenario range: conservative case based on industry-average improvement rates, base case based on their current operational data, upside case based on the best outcomes their peer set has achieved. That range is more defensible than a single point estimate and more useful for forecasting.
Cass Information Systems operates a structurally similar model in freight audit and payment. Cass handles freight invoice processing and payment for large manufacturing and retail shippers, charging a percentage of the freight spend they manage. A customer routing $50 million in annual freight through Cass pays a take rate on that spend. As the customer’s business grows, TAW grows automatically. Cass processes over $40 billion in freight payments annually, which means their TAW across the customer base grows with the economy rather than requiring any deliberate expansion motion.
Site and location-based models are common in operational technology sold to multi-location businesses. Toast, the restaurant point-of-sale platform, prices on a per-location basis starting at $69 per month per restaurant, with additional modules layered on top. A restaurant group with 45 locations that runs Toast at 12 of them is at 27% wallet share by location count, and the TAW calculation is simply total location count times the monthly per-location contract value. Toast serves over 106,000 restaurant locations and tracks location expansion rate as its primary growth metric in investor communications. This is a clean, observable ceiling.
Samsara, the fleet and operations management platform, operates the same way but with vehicles and fixed assets as the unit. A logistics company with 400 trucks that has Samsara deployed on 150 is at 37.5% wallet share. TAW is total fleet size times contract rate per vehicle. Fleet size is generally discoverable through public records, customer conversations, or industry databases.
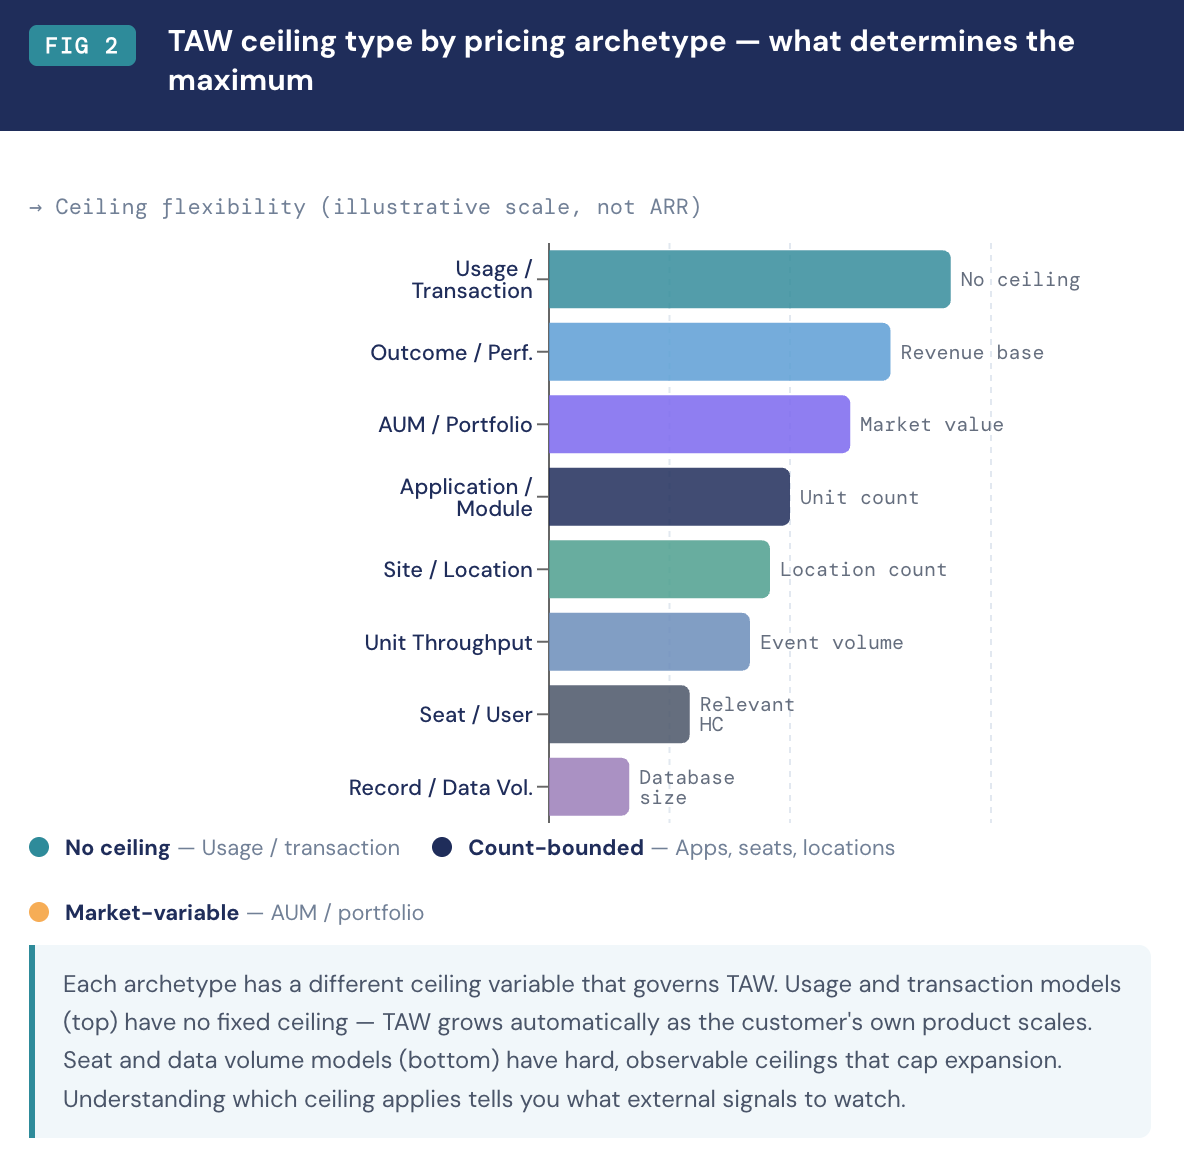
Transaction volume models are the defining structure of API-native businesses. Twilio prices SMS at $0.0083 per message sent or received in the US, with similar per-event pricing across voice, WhatsApp, and video. A company sending 500,000 customer alerts per month is paying roughly $4,000 per month on SMS alone. TAW is their total anticipated message volume across all channels times the applicable rate. Twilio’s consistently above-120% net dollar retention is not magic. It is the mathematical consequence of a pricing model where customer growth and vendor revenue grow together automatically. The challenge for RevOps teams at Twilio-type businesses is that TAW has no fixed ceiling. It scales with the customer’s own product engagement, which means the expansion signal is usage volume growth, not seat count or module gaps.
Snowflake operates the same way, charging on compute credits consumed and storage per terabyte. A data team running light analytical workloads pays far less than one running heavy transformation pipelines on large datasets, and Snowflake’s revenue grows as data volumes and query complexity increase. In Snowflake’s case, TAW is estimated by understanding the customer’s current data architecture and where it is heading, which is why their sales motion is so deeply technical.
AUM and portfolio-based models are concentrated in financial services technology. Addepar, the wealth management platform for RIAs and family offices, charges between 0.008% and 0.03% of assets under management. A firm managing $220 million in assets pays roughly $65,000 annually. TAW is AUM times the applicable basis-point rate. Addepar’s own research, published in a Sacra analysis of their business, shows they manage $7 trillion in assets across approximately 1,200 client firms. The RevOps complexity here is that AUM fluctuates with markets. A customer whose portfolio falls 20% in a down quarter is not using the platform any less, but their TAW shrinks mechanically. This creates a structural mismatch between the effort required to retain a customer and the revenue that customer generates, which means renewal conversations have to account for market conditions as an exogenous variable in the TAW calculation.
Record and data volume models price on how much data a customer manages within the platform. HubSpot’s Marketing Hub is the most visible example. Professional tier starts at $890 per month and includes 2,000 marketing contacts. Contacts above that threshold are charged in tiers. A company with 80,000 contacts in their database has a clearly defined TAW ceiling based on how many they are actively managing through HubSpot. ZoomInfo operates similarly, pricing on the number of records and contact exports a customer can access annually. Customers who are consistently hitting their export limits are the clearest expansion signal in a data volume model, because they are demonstrating that the contracted ceiling is below their actual need.
How to detect which model applies
Most companies know their own pricing model. The problem for RevOps is detecting it on the customer side when you are looking at CRM data rather than a pricing sheet. The signals are usually there.
Deal amount distribution tells you a great deal. If contract values cluster around predictable multiples of a base number, you are almost certainly in a seat or module model. If they spread across a continuous range, you are more likely in a usage or throughput model. Run a distribution of your ACV across your book of business and look at the pattern.
Line item structure in your CPQ or billing system is even more direct. If your quotes contain quantity fields that customers fill in with headcount or unit counts, you are in a seat or unit model. If quotes contain commitment tiers with overage clauses, you are in a usage model. If every quote is a flat platform fee, you are in a tier model. The structure of what you sell is the structure of your TAW formula.
Renewal versus expansion ratios within the customer base reveal the model behavior over time. Module and application models tend to show larger expansion jumps at discrete intervals, when a customer adds a new application rather than gradually increasing usage. Seat models show smoother, more incremental expansion correlated with the customer’s hiring cycles. Usage models show expansion that is continuous and correlated with the customer’s own product activity.
For customers where you do not have visibility into the underlying signals, the deal naming conventions your AEs use often encode the model implicitly. A deal named “Acme Corp - 45 Seats - Enterprise” is different from “Acme Corp - FCC Unit - Phase 2” in ways that tell you exactly which formula applies.
Building wallet share into the RevOps motion
Calculating TAW is not a one-time exercise. It is a data field that belongs in CRM, updated on a cadence, and connected to how you prioritize accounts, set quotas, and run renewals.
The practical starting point is a TAW field per account, ideally with a confidence score alongside it. A seat-based TAW calculated from a customer’s LinkedIn headcount has lower confidence than one calculated from a signed MSA that specifies headcount. An application-based TAW estimated from public documentation has lower confidence than one discussed explicitly in a QBR. Tracking confidence lets you know where to invest in better data and where to trust the estimate you have.
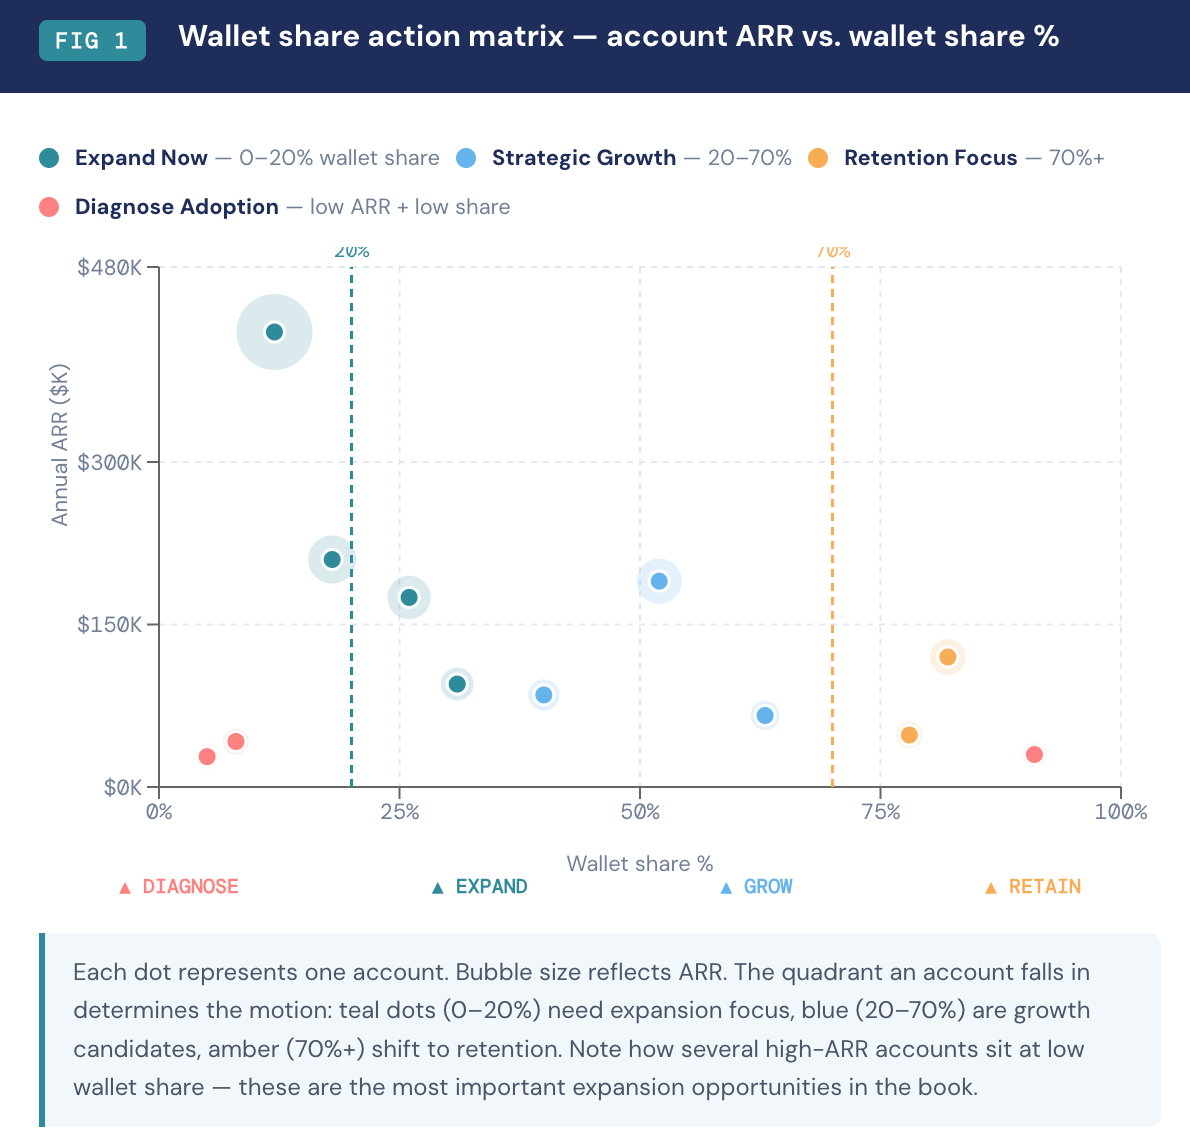
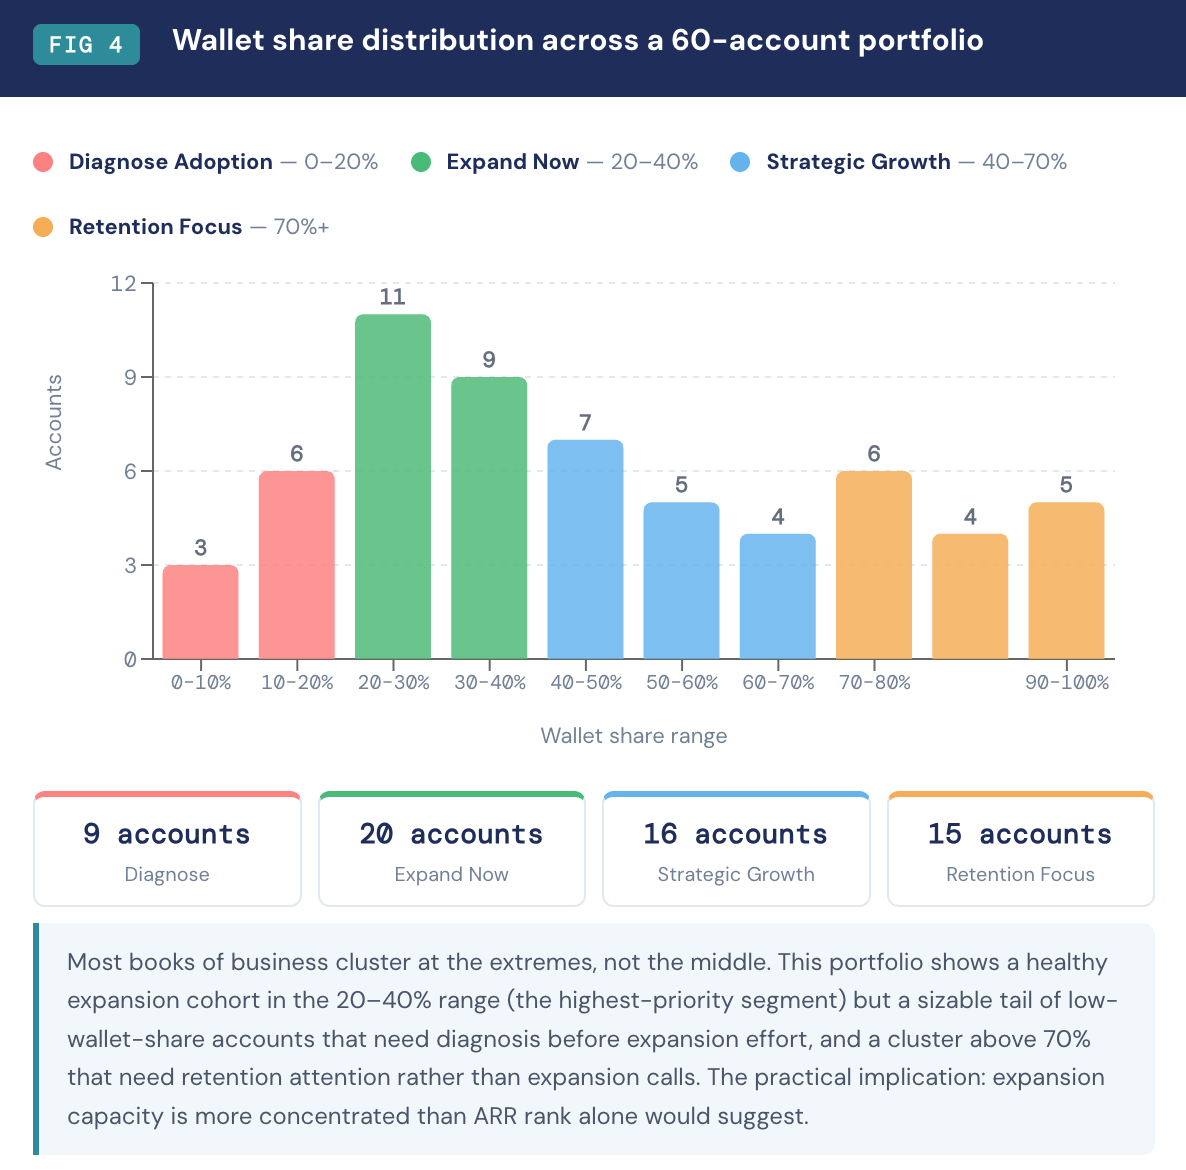
Account prioritization changes materially when wallet share is available. The accounts worth investing expansion effort in are those sitting in the 20% to 40% wallet share range, where there is meaningful room to grow and the customer has demonstrated value fit by continuing to pay. Accounts below 20% wallet share need diagnosis before expansion conversation: low share could mean the product is not being used, the champion has left, or the customer made a smaller initial commitment than expected. Accounts above 80% wallet share need a different conversation entirely, focused on retention, strategic partnership, or cross-sell into adjacent products.
Forecast accuracy improves when deals are cross-referenced against TAW. An AE projecting a $500,000 expansion on an account with a $600,000 TAW ceiling is sizing the deal correctly relative to what is available. The same AE projecting $1.2 million expansion on the same account is either miscalculating TAW, or there is a product or pricing change implicit in the deal that should be made explicit. Automated flags on deals that exceed TAW are a straightforward RevOps build that catches forecast errors before they propagate into the board-level number.
Churn risk signals also change shape through a TAW lens. A customer at 95% wallet share who is not showing signs of growth is not necessarily a churn risk, but they are a saturation risk. They have bought nearly everything they can buy at their current scale. If their business is not growing, your revenue from that account is effectively flat for the foreseeable future. If their business is growing, they need a conversation about the next product tier or the next product line, not just an annual renewal. The wallet share number surfaces this before the renewal lands on someone’s desk as a surprise.
QBR preparation becomes more targeted when wallet share is in the room. A customer at 30% wallet share needs a conversation about what gaps look like and what the path to the next application or module would require. A customer at 75% wallet share needs a conversation about their growth plans and how you can grow with them. Those are structurally different QBRs, and the difference starts with knowing the number before walking in.
What good looks like
The best wallet share implementations share a few characteristics. They treat TAW as an estimate with an explicit confidence tier rather than a precise number, because precision here is often false precision. They update the estimate on a quarterly cadence, or faster when a triggering event occurs: a customer acquisition, a hiring announcement, a new market entry, a product expansion on their side.
They connect TAW to quota assignment and territory planning. An AE given an account with 80% wallet share has less expansion capacity than one given an account with 25% wallet share, and compensation models should reflect that rather than treating all accounts as equivalent in their growth potential.
They build model-specific detection logic into CRM. If a deal has a quantity field with a value, it is a seat or unit deal. If it has a commitment tier and overage rate, it is a usage deal. Tagging deals at creation forces clean data from the start rather than trying to back-fill it later.
They also account for multi-model customers. HubSpot is the clearest example of why this matters. A single HubSpot customer can span Marketing Hub priced on marketing contacts, Sales Hub priced on seats, Service Hub priced on seats, and Operations Hub priced on seats. Each has a different TAW formula and a different ceiling. Total wallet share for that customer is the sum of four separate calculations, not a single number. Companies that sell multiple product lines at different pricing structures need to run TAW at the product-line level and roll it up to the account level.
Finally, the best implementations treat TAW as a living input to expansion planning rather than a reporting artifact. A customer who announces they are opening 15 new locations is signaling TAW expansion before the contract conversation begins. A customer who publishes a job posting for a new sales operations leader is signaling seat demand before an AE has dialed in. Connecting external signals to TAW estimates, systematically and not just in ad hoc account reviews, is what separates companies that catch expansion opportunities early from those that discover them at renewal.
The math behind wallet share is not complicated. Tracking AUM times basis points or fleet size times vehicle rate is not a difficult calculation. What is difficult is the discipline of deciding which formula applies to which customer, building that into CRM cleanly enough that it can be queried and acted on, and using it consistently enough that it becomes part of how your team thinks about accounts rather than a dashboard metric that gets referenced once a quarter.
The companies that do this well do not have better software than the ones that do not. They have made a decision about what information matters for account prioritization and built the habit of keeping it current. That is a RevOps decision first, and a technology decision second.
Paid member download: Wallet Share Calculator
This workbook does the math across all eight pricing archetypes covered in this article. Enter your current ARR and four account-level inputs, and it calculates Total Addressable Wallet, wallet share percentage, and expansion capacity instantly. The Portfolio View tab rolls up to 60 accounts into a ranked prioritization list with action signals built in. There’s also a Model Selector tab that tells you which archetype applies to a given customer and what data you need to calculate their TAW, plus a Reference Guide with the TAW formula, expansion signals to watch, and confidence scoring guidance for each model.
If you’ve been sizing expansion opportunities off ARR alone, this is the tool that shows you what you’ve been missing.
