
Forecasting in a usage based world

Most finance teams are still running forecasting processes designed for a world where revenue = contracts × time. That math doesn’t work anymore.
Usage based pricing turns forecasting from a deterministic exercise into a probabilistic one. You’re predicting how customers will behave after they sign, which is a fundamentally different problem than predicting when deals will close.
Why your current forecast model is lying to you
Traditional SaaS forecasting follows a simple logic:
Pipeline value × Win rate = Expected bookings
Bookings × Recognition schedule = Revenue
It’s clean. It’s predictable. CFOs love it because they can answer “are we on plan?” with confidence.
Usage based pricing breaks this at every step.
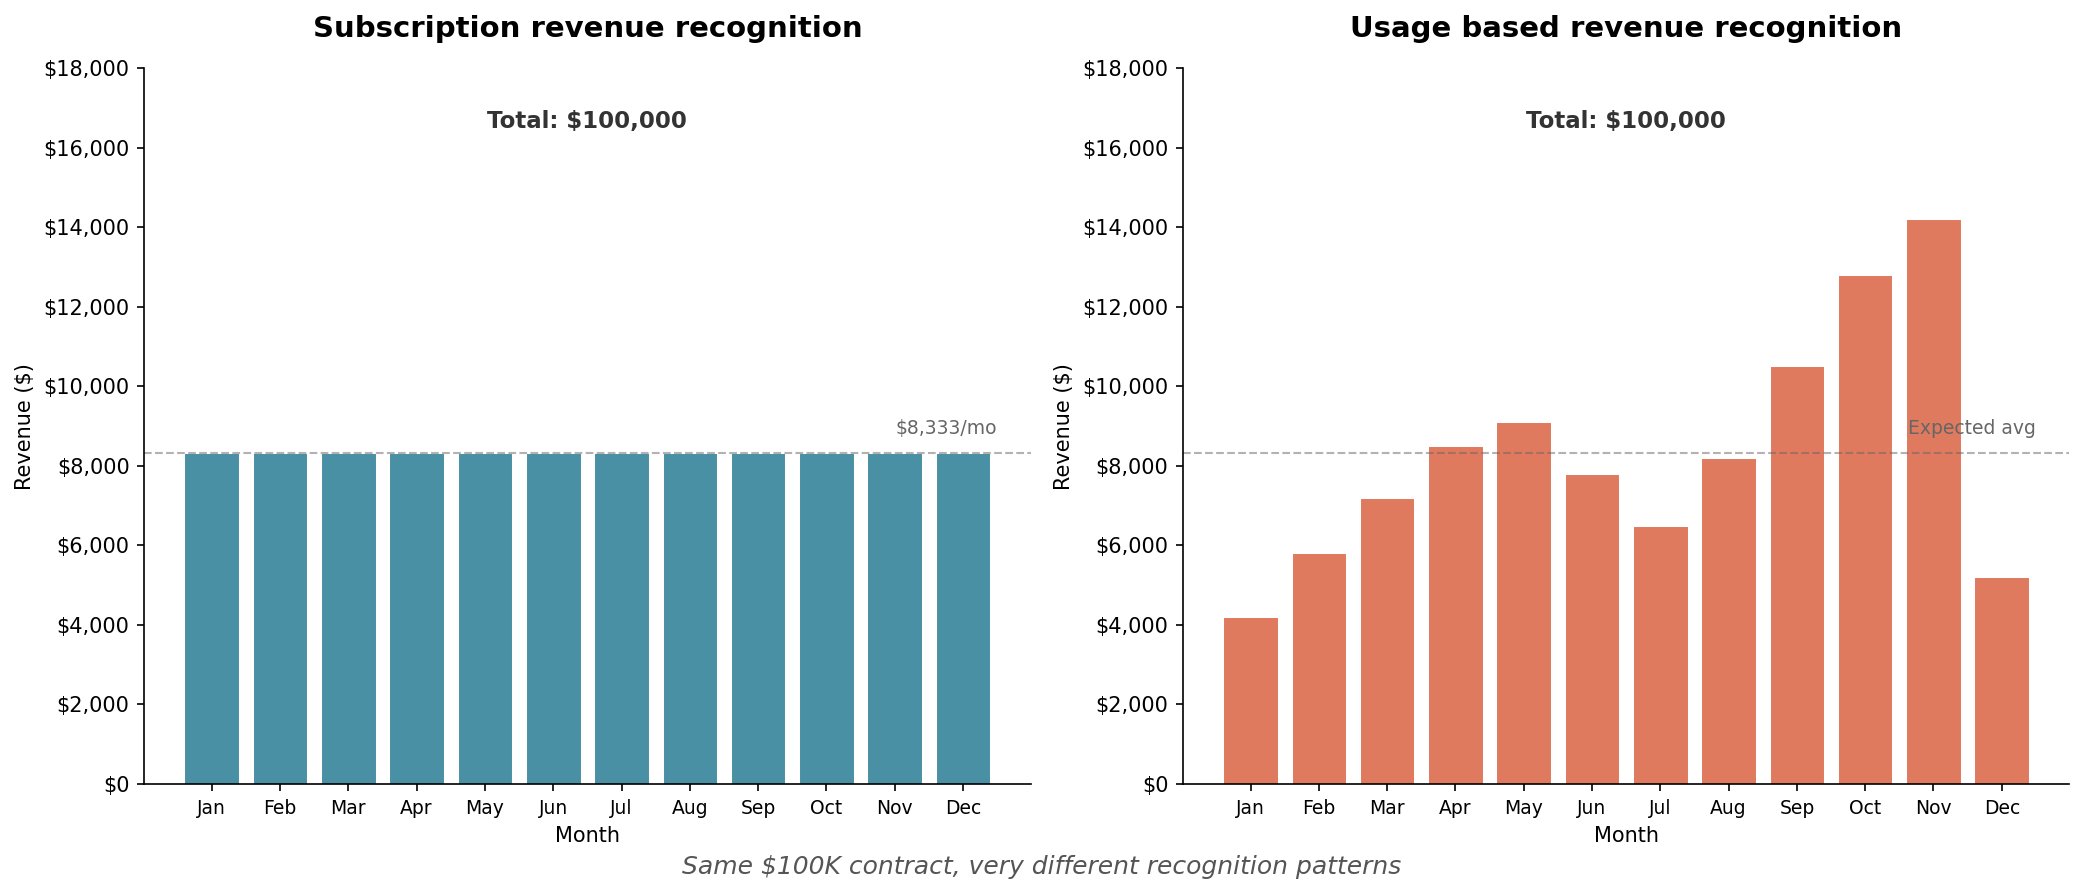
First, the deal value itself is uncertain. When a customer signs a $100K annual commitment with overage pricing, you don’t actually know if that’s a $100K deal or a $180K deal. It depends on what they do after they sign.
Second, the recognition schedule is no longer fixed. Revenue happens when usage happens. A customer might front-load their usage in Q1 and go quiet in Q4. Or the reverse. Or something entirely unpredictable.
Third, expansion doesn’t require a sales motion anymore. Customers can grow their spend without anyone at your company doing anything. Great for efficiency, terrible for forecasting, because the traditional signals (pipeline, opportunity stages, rep forecasts) don’t capture it.
The 2025 Metronome State of Usage Based Pricing report found that 73% of SaaS companies with usage based models are actively forecasting variable revenue. Which means 27% are just hoping for the best. Neither group has cracked it.

The three scenario framework
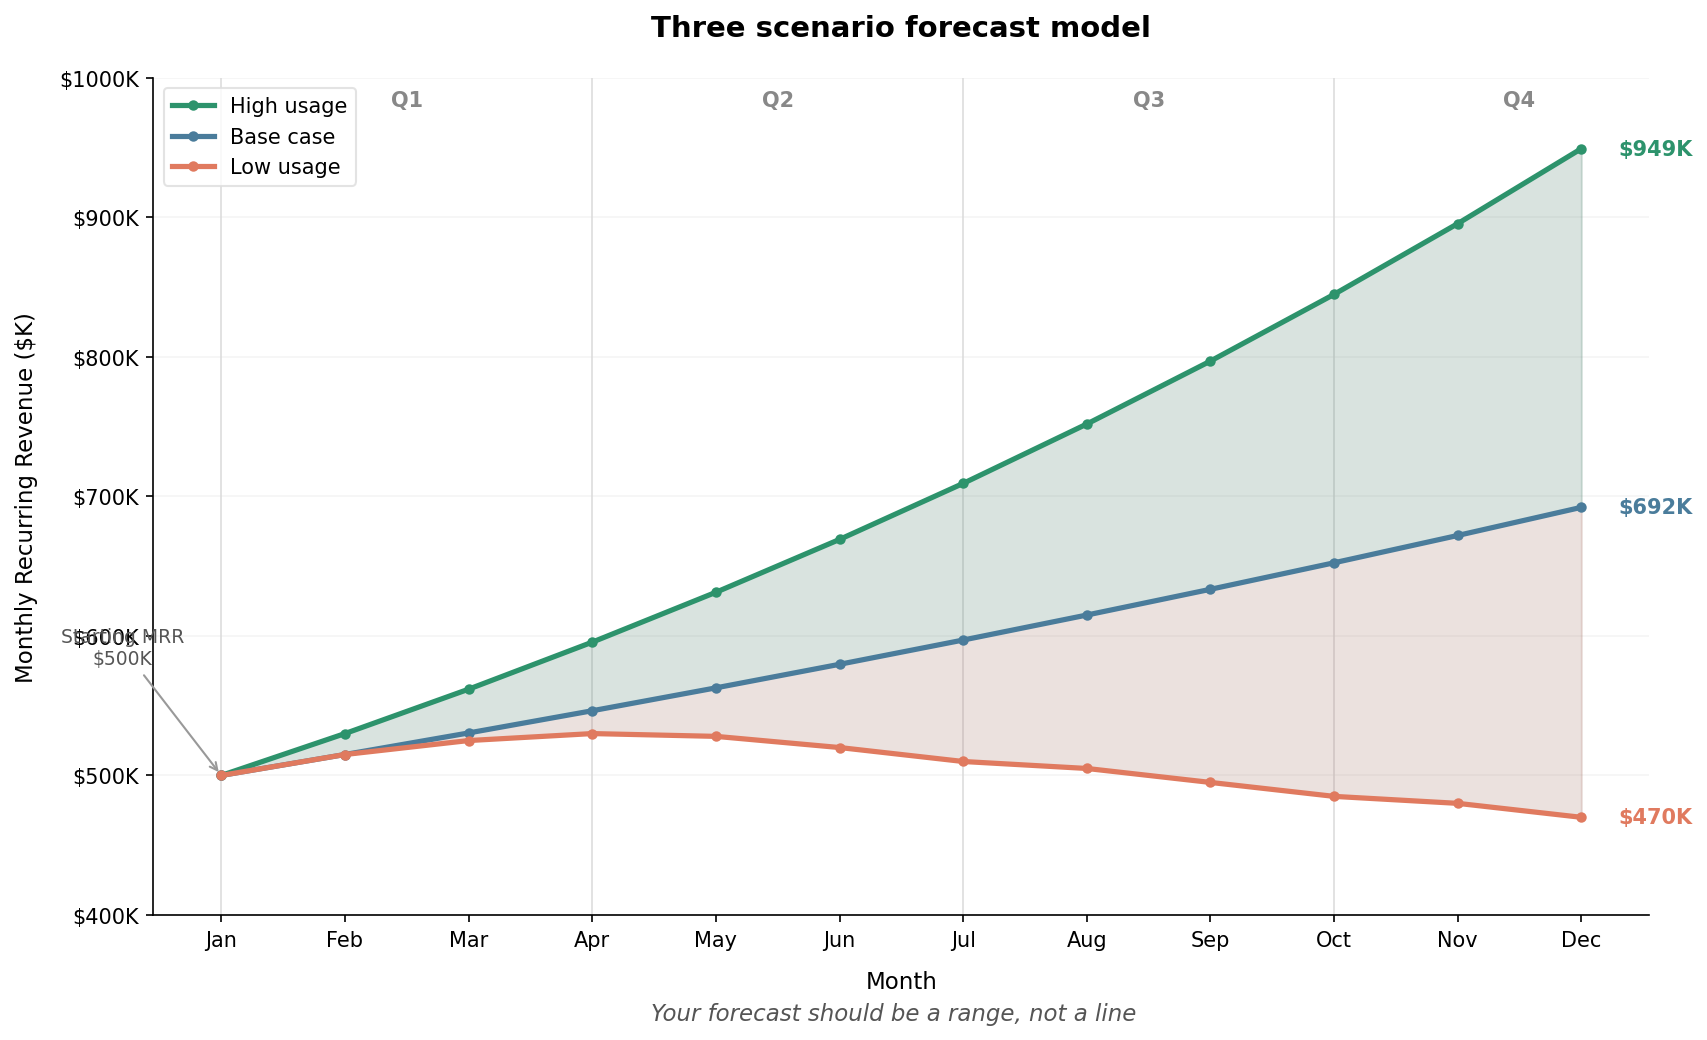
If you can’t forecast a single number with confidence, stop trying. Forecast ranges instead.
The standard approach is three scenarios: base case, high usage, and low usage. But most teams build these wrong. They take their base case and add or subtract 10% for the other scenarios. That’s wishful thinking with error bars.
Real scenario planning requires you to change multiple correlated variables within a cohesive narrative. For usage based revenue:
Base case (most likely):
You assume current usage trends continue. Existing customers maintain their consumption velocity. New customers ramp along historical cohort curves. Churn stays at trailing 12 month rates. No major product launches or market disruptions.
High usage case:
You assume customers increase usage 20 to 30% above current trends. This could happen because of a successful feature launch, seasonal demand (Q4 budget flush, for example), or macro tailwinds in your market. Important: higher usage often means higher COGS, so you need to model margin compression alongside revenue growth.
Low usage case:
You assume customers decrease usage 20 to 30% below current trends. This is the “engagement problem leads to churn” scenario. Usage drops often precede cancellations by 60 to 90 days, so low usage isn’t just a revenue problem. It’s a leading indicator of retention risk.
You’re trying to understand the range of outcomes you’re managing toward, and to have contingency plans for each.
Snowflake’s approach to consumption forecasting
If you want to learn from someone who’s figured this out, study Snowflake.
Snowflake’s entire revenue model depends on predicting customer behavior. They’ve built what might be the most sophisticated consumption forecasting operation in enterprise software.
A few things they’ve learned:
Forecasting is a data science problem. Snowflake built machine learning models to predict revenue at the customer level, daily. They treat forecasting like a time series prediction exercise, where historical consumption is the primary input.
New customers are the hardest to forecast. When a customer has no usage history, you need proxies. Snowflake segments new customers by employee count, because a 10,000 person company behaves very differently from a 500 person one. Their consumption velocity, workload adoption, and seasonality patterns all diverge.
Accuracy improves with tenure. Snowflake uses different models for different customer ages. Months 0 to 3 get a “cold start” model based on proxies. Months 3 to 12 get a hybrid model that blends proxies with actual usage data. Beyond month 12, they rely primarily on the customer’s own consumption history.
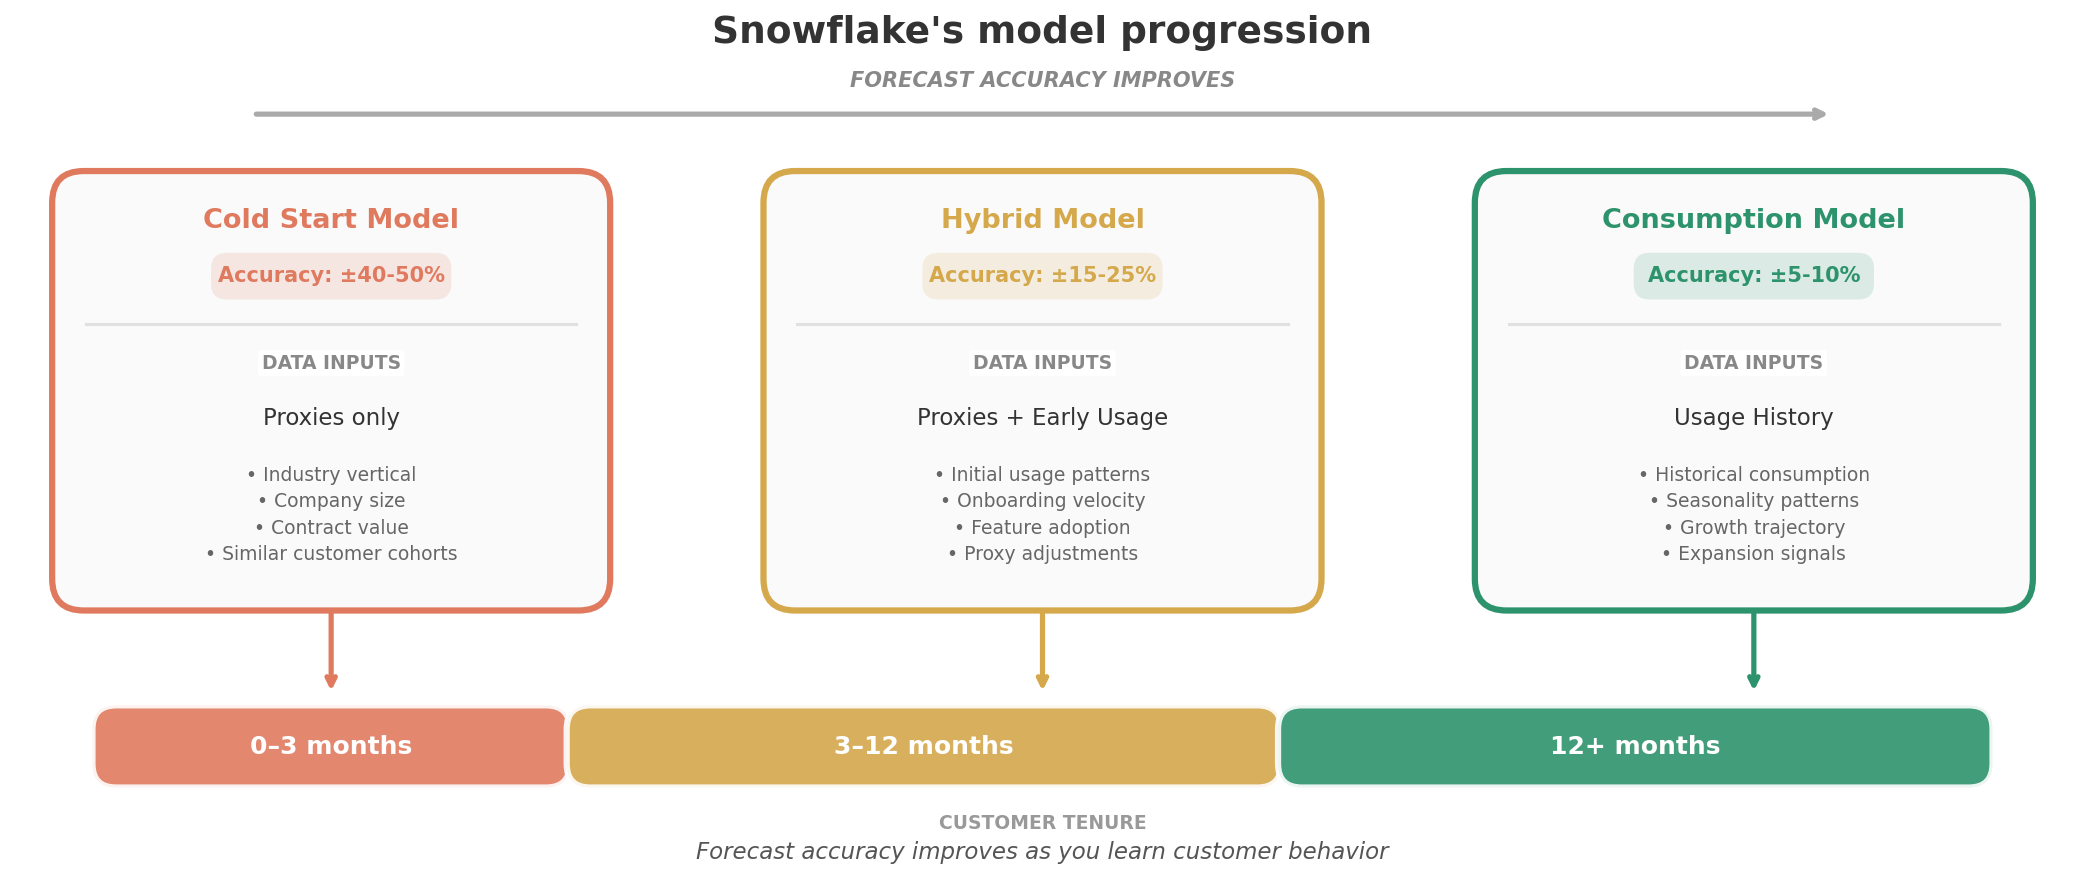
This approach brought Snowflake’s revenue forecast accuracy to single digit percentage error. That’s remarkable for a consumption based business. Most companies would be thrilled to hit 15%.
The catch: building this capability required dedicated data science resources, sophisticated infrastructure, and years of iteration. Snowflake literally used their own product to build their forecasting models. Most companies don’t have that luxury.
🎭 MEME IDEA: “We have X at home” Kid: “Mom, can we have Snowflake’s forecasting model?” Mom: “We have forecasting at home” Forecasting at home: [Screenshot of a messy Excel spreadsheet with #REF errors]
What you can do without a data science team
You probably don’t have Snowflake’s resources. That’s fine. A pragmatic approach can get you most of the way there.
Step 1: Segment your revenue into buckets
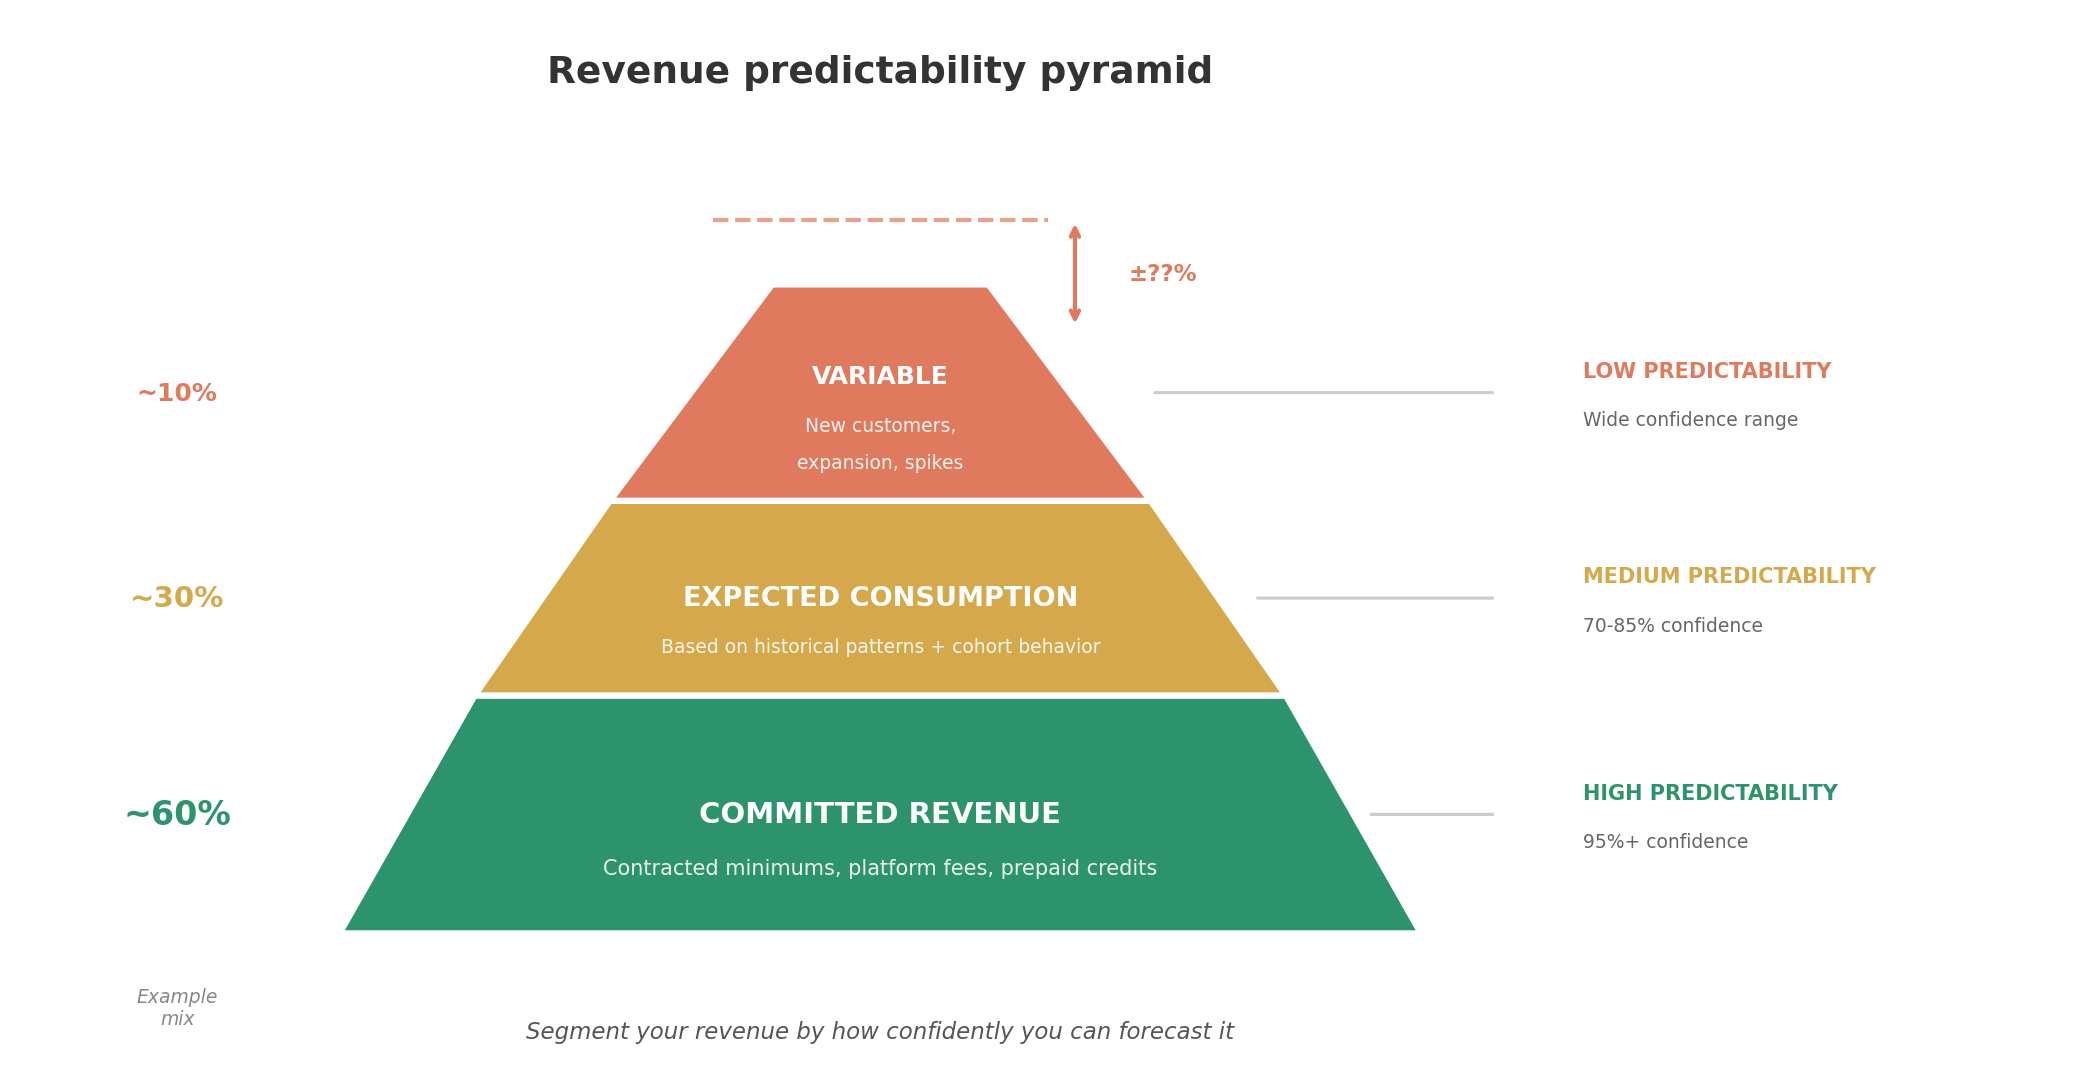
Not all revenue is equally predictable. Break yours into three categories:
Committed revenue is contractually guaranteed. Minimum commitments, prepaid credits, subscription floors. This is your baseline, and it’s highly predictable.
Expected consumption is usage you can reasonably forecast based on historical patterns. Existing customers with 6+ months of usage history fall here. You can model their behavior with decent accuracy.
Variable consumption is usage you can’t predict reliably. New customers, customers with volatile usage patterns, and overage revenue fall here. Don’t pretend you can forecast this precisely. Build ranges instead.
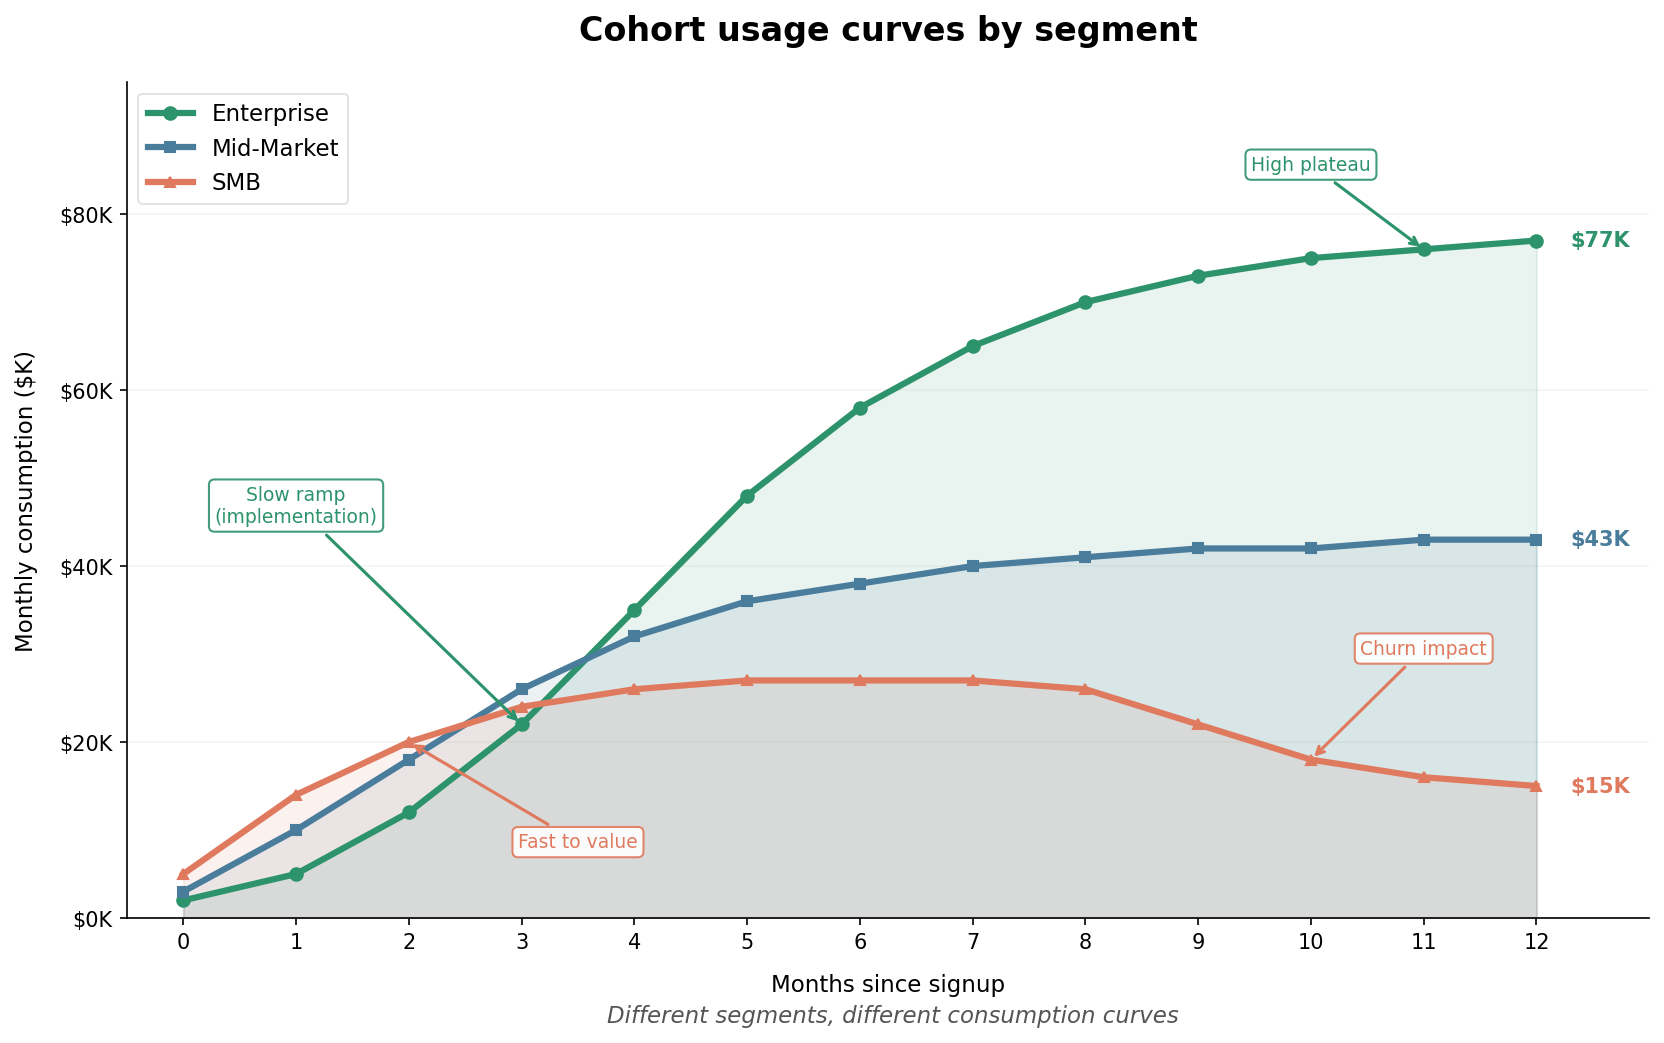
Step 2: Build cohort based usage curves
Track how consumption evolves over time for different customer segments. Most usage based businesses see a pattern: usage is low in months 1 and 2 as customers implement and onboard, then ramps through months 3 to 6, then stabilizes (or expands) after month 6.
Your cohorts might look different. Enterprise customers might take longer to ramp but stabilize at higher levels. SMB customers might ramp faster but have higher churn risk. The point is to have curves you can apply to new customers based on their segment.
Step 3: Model seasonality explicitly
Usage based revenue often has seasonality that subscription revenue doesn’t. Q4 might spike because customers are spending year end budgets. Summer might dip because decision-makers are on vacation. Your product might have its own patterns (tax software in April, ecommerce in November).
Build seasonality factors into your model. If Q4 is historically 1.25x your average quarter and Q3 is 0.85x, bake that in. Don’t let “unprecedented” seasonal swings surprise you every quarter.
Step 4: Shorten your forecast horizon
Quarterly forecasts are too long for usage based models. By the time you’re halfway through Q2, your Q2 forecast should be pretty accurate because you’ve seen two months of actual usage data.
Move to monthly rolling forecasts. Update them weekly with actual usage data. The goal is to reduce the time between “here’s our forecast” and “here’s what actually happened” so you can recalibrate faster.
Twilio’s CFO noted that despite their usage based model, they could forecast quarterly revenue within a 2 to 3% margin. That accuracy came from tight feedback loops and continuous recalibration.
The coverage ratio problem
In traditional SaaS, pipeline coverage is straightforward. If you need $10M in bookings and your average win rate is 25%, you need $40M in pipeline. That’s 4x coverage.
Usage based models break this math in two ways.

First, your “bookings” number is uncertain. If a customer signs a $100K commitment but typically runs at 150% of commitment, is that a $100K booking or a $150K booking? Your coverage ratio depends on which number you use.
Second, a significant portion of your revenue doesn’t come from pipeline at all. Expansion from existing customers, overage charges, and consumption growth happen without a sales opportunity being created.
Coverage in a usage based world works differently:
For new logo revenue: Use traditional pipeline math, but apply it to committed values only. If you need $5M in new customer commitments, calculate coverage based on your committed pipeline.
For expansion revenue: Don’t use pipeline coverage. Use usage trend analysis instead. What percentage of your existing customers are on track to exceed their current plans? What’s the average overage revenue per customer in that cohort? Model expansion as a function of usage behavior.
For total revenue: Combine both models. Your new logo forecast comes from pipeline. Your expansion forecast comes from usage trends. Your total forecast is the sum of both, with appropriate uncertainty ranges.
The reforecasting cadence question
How often should you update your forecast?
The traditional answer is quarterly, with a mid quarter check in. That cadence was designed for businesses where revenue recognition is predictable and changes happen slowly.
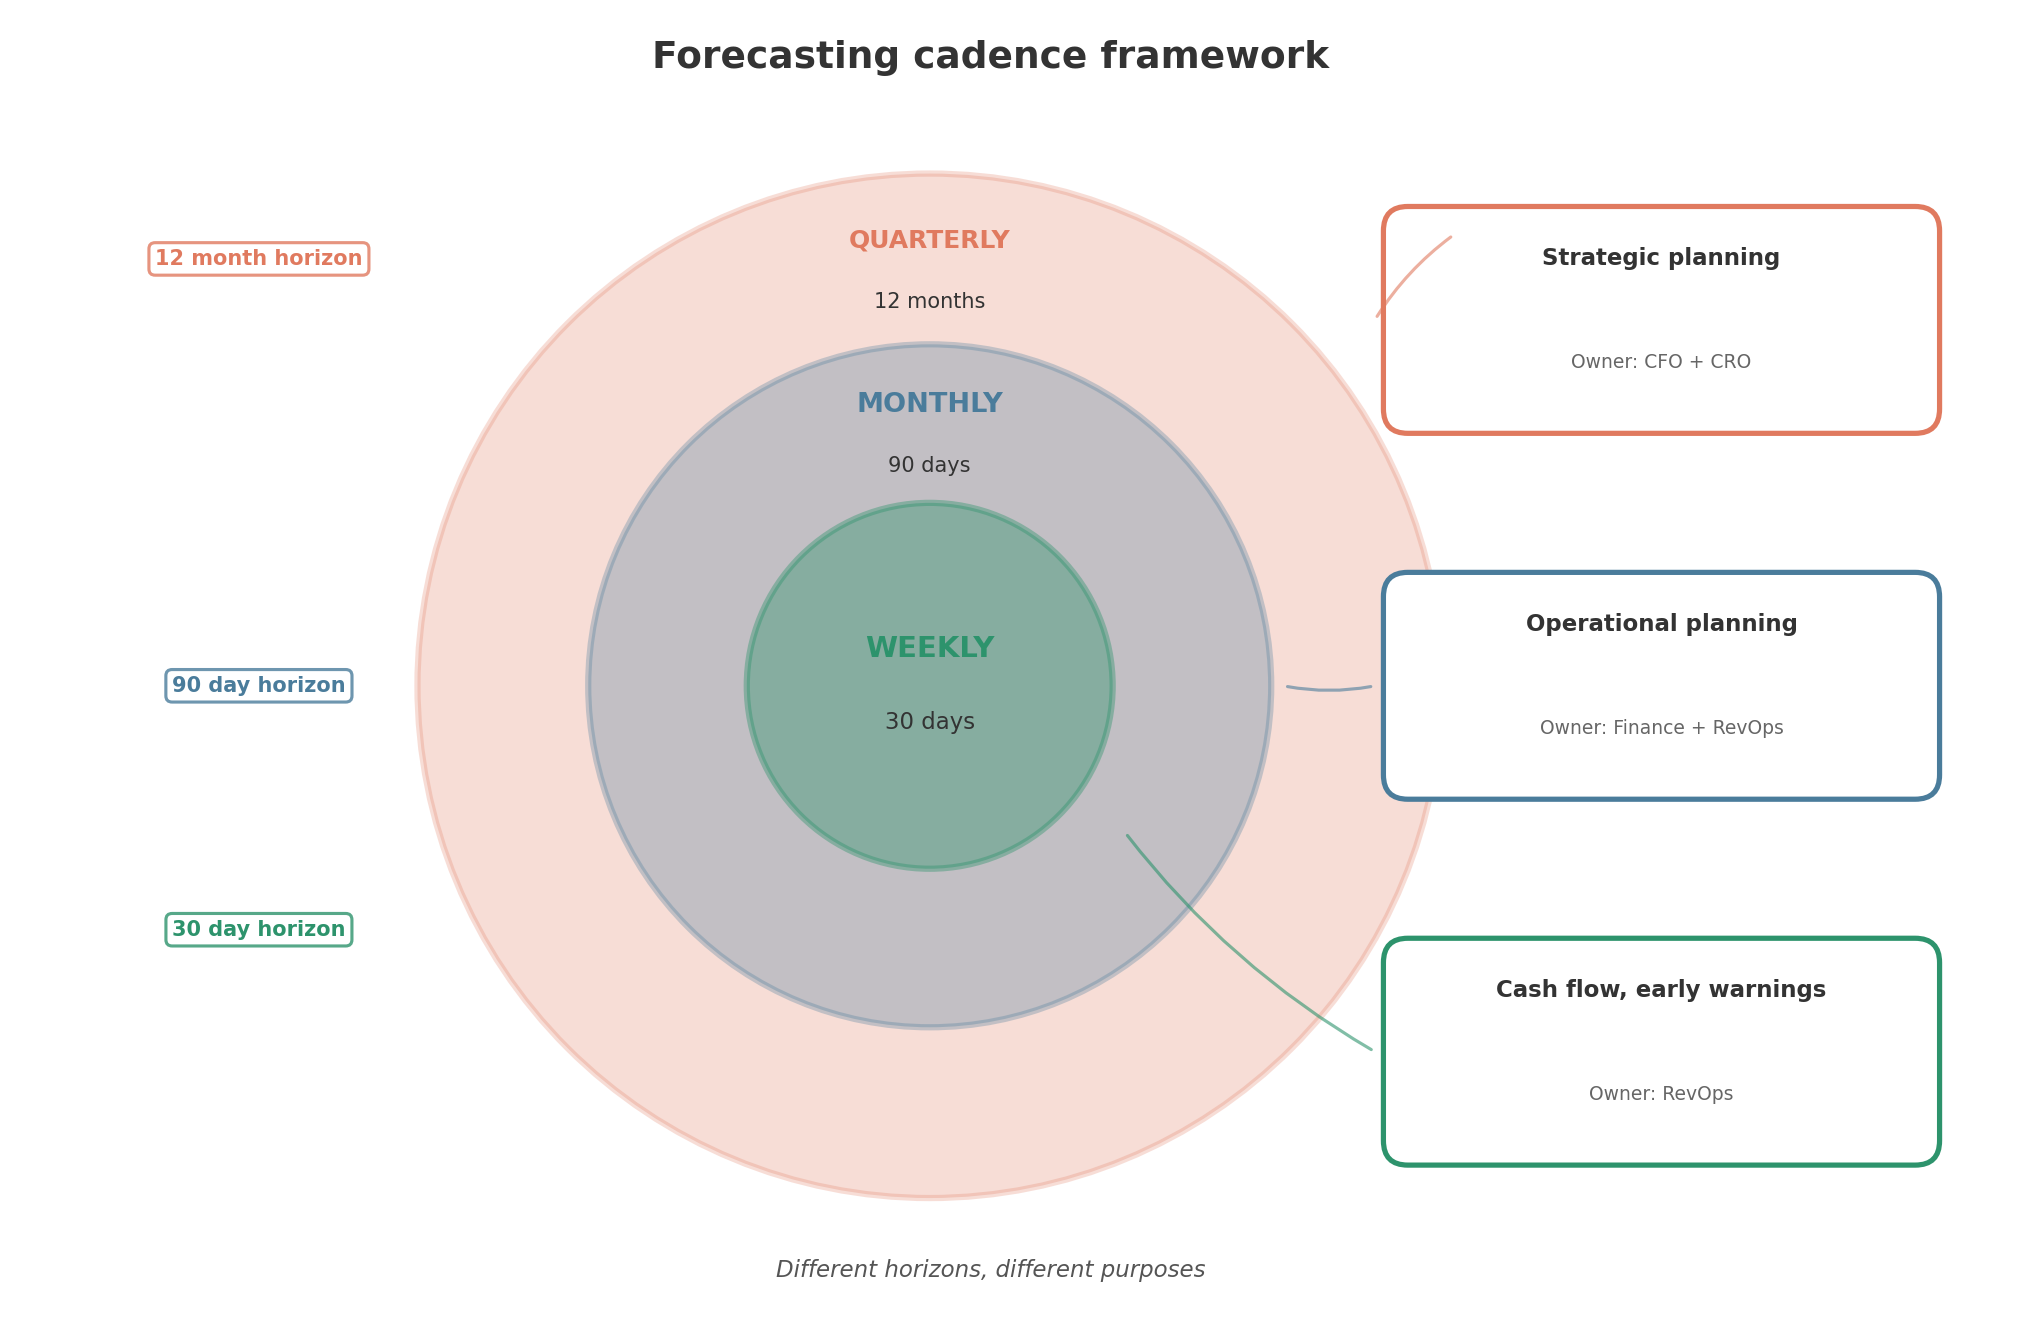
Usage based revenue changes faster. I’d argue for this cadence instead:
Weekly: Update your 30 day view. This is primarily a cash flow management exercise. What usage are you seeing this week? Is it tracking to your monthly expectation? Any customers showing unusual patterns?
Monthly: Update your 90 day rolling forecast. Incorporate the prior month’s actuals, recalibrate your cohort curves, and adjust your scenarios. This is your operational forecast for hiring, spending, and resource allocation.
Quarterly: Update your annual plan. This is your strategic forecast for board reporting and long range planning. It should reflect everything you’ve learned from the prior quarter’s actuals.
The goal is to catch variances early. If a major customer’s usage drops 40% in week 2, you want to know immediately so you can trigger a CS intervention. You don’t want to discover it when you miss your quarter.
What triggers an off cycle reforecast
Some events should trigger an immediate reforecast, regardless of your normal cadence:
API or infrastructure pricing changes from your vendors. If your costs change, your margin assumptions change, which may affect how aggressively you pursue certain customer segments.
Major product launches. New features often change usage patterns. Sometimes dramatically. A successful AI feature launch could spike consumption 50% overnight.
Usage pattern shifts. If you see a cohort of customers suddenly change behavior (up or down), don’t wait for the monthly cycle. Investigate and recalibrate.
Market disruptions. Macro events, competitor moves, or regulatory changes can all affect customer behavior. Build in the discipline to reassess when the world changes.
You don’t need to reforecast constantly. Reforecast when your assumptions are invalidated. If nothing changes, your forecast shouldn’t either.
The organizational challenge
Forecasting usage based revenue requires different skills and different ownership than traditional revenue forecasting.
In a subscription business, Finance owns the forecast. They take bookings data from Sales, apply recognition schedules, and produce revenue projections. It’s a relatively mechanical process.
In a usage based business, Finance can’t do it alone. They need:
Product data on usage patterns, feature adoption, and customer behavior Engineering support to pipe usage telemetry into forecasting models Customer Success input on which accounts are at risk and which are expanding Sales context on committed deals and expected overages
This is fundamentally a cross functional problem. And in most organizations, nobody owns it end to end.
If you’re a RevOps leader, this is your opportunity. Someone needs to orchestrate the data flows, build the models, and translate usage patterns into revenue projections. That someone should probably be you.
The bottom line
Forecasting in a usage based world is harder than forecasting subscriptions. It requires more data, more sophisticated models, and more frequent updates. It demands cross functional collaboration and organizational change.
But it’s possible. Snowflake does it. Twilio does it. AWS does it. The companies that have figured this out treat forecasting as a core competency.
The prize for getting it right is significant. Accurate forecasts enable better capital allocation, smarter hiring, and more confident board conversations. They also make you look like you know what you’re doing, which, in a world where most companies are winging it, is worth something.
Start with the basics: segment your revenue, build cohort curves, model seasonality, and shorten your forecast cycles. You won’t get to Snowflake level accuracy overnight. But you’ll get better than hoping for the best.
And right now, that’s a competitive advantage.
Paid template this week!
Cohort Curve Builder
Track how different customer segments consume over time and use those patterns to forecast new customer revenue. Enter your customer data, and the template automatically builds consumption curves by segment, compares actual vs. benchmark performance, and projects revenue from future cohorts. Includes built-in churn detection for SMB customers and variance alerts when cohorts underperform. Get it below 👇
